LandOS Tutorial & FAQ
Tutorial with screenshots
LandOS
LandOS brings together global and regional geospatial datasets to support ecosystem assessment, carbon accounting, and project design. It combines project management, quantitative analysis, and geospatial tools so teams can understand their landbase, quickly assess pre-feasibility, organize project information, and make better decisions.
Projects Table
After logging in and joining your organization, you land on the Projects Table. This table lists all projects you have created, each representing a coherent set of activities that can include one or many polygons and one or multiple interventions (for example, REDD+, ARR, or a combination).
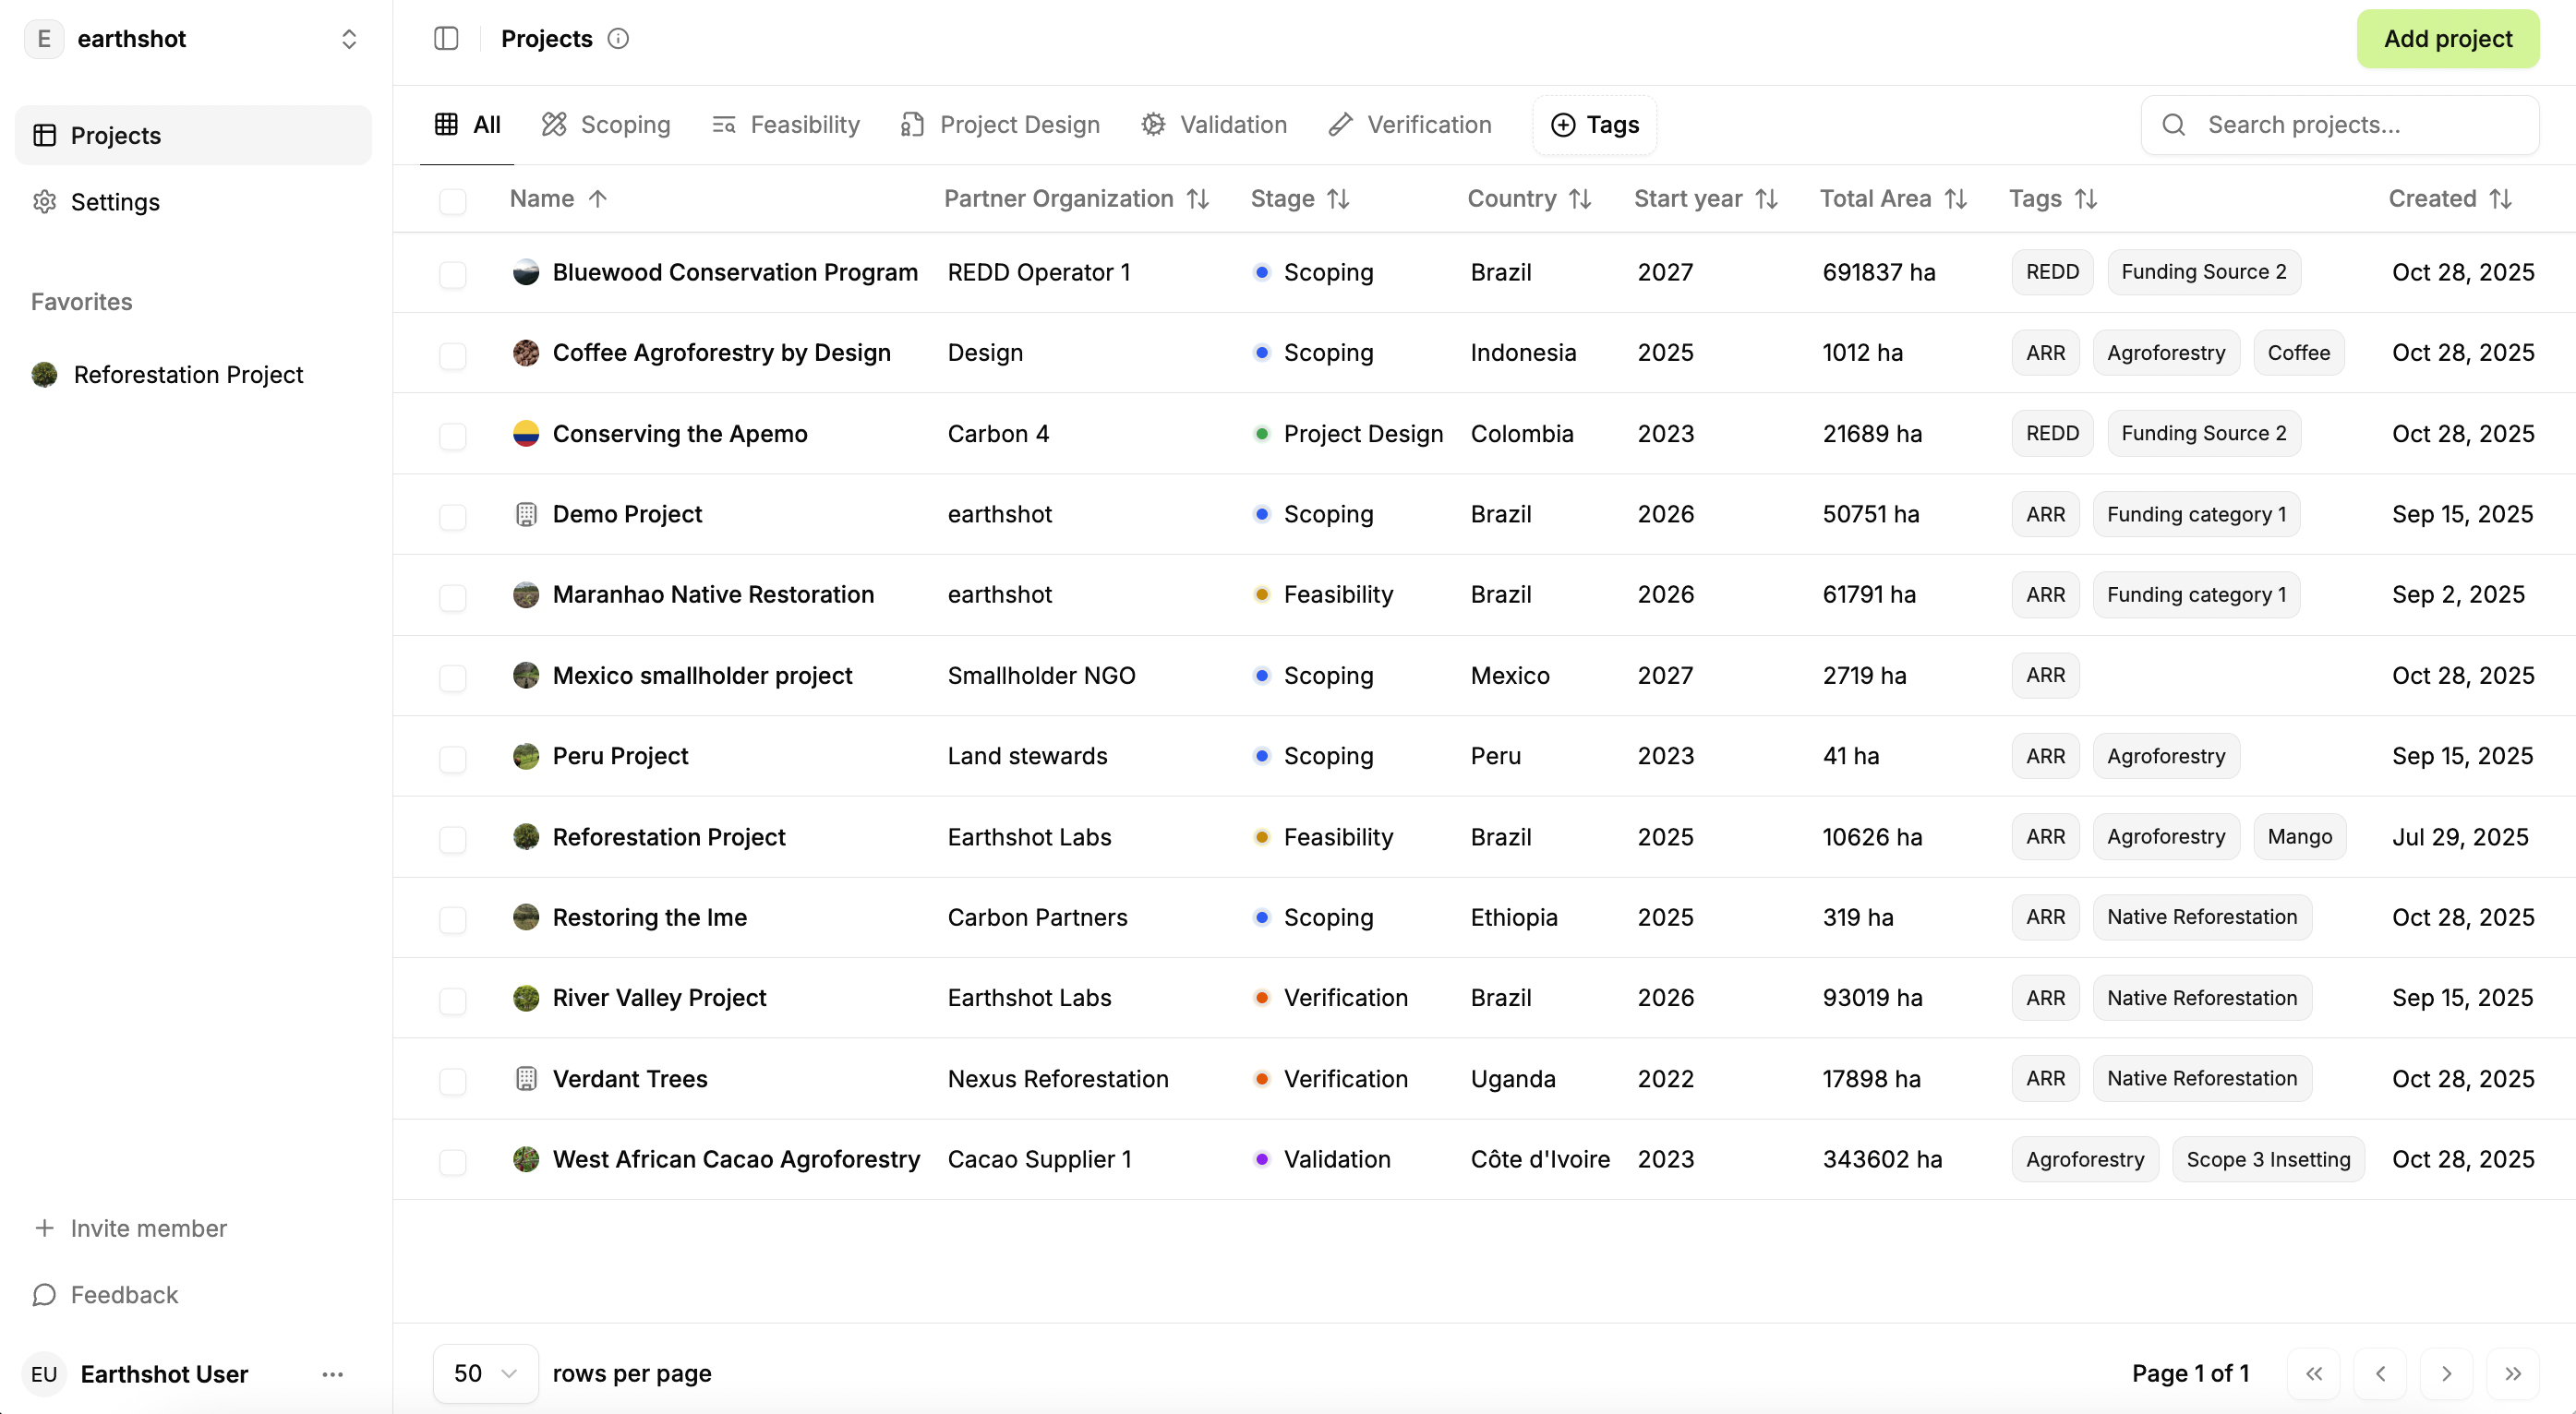
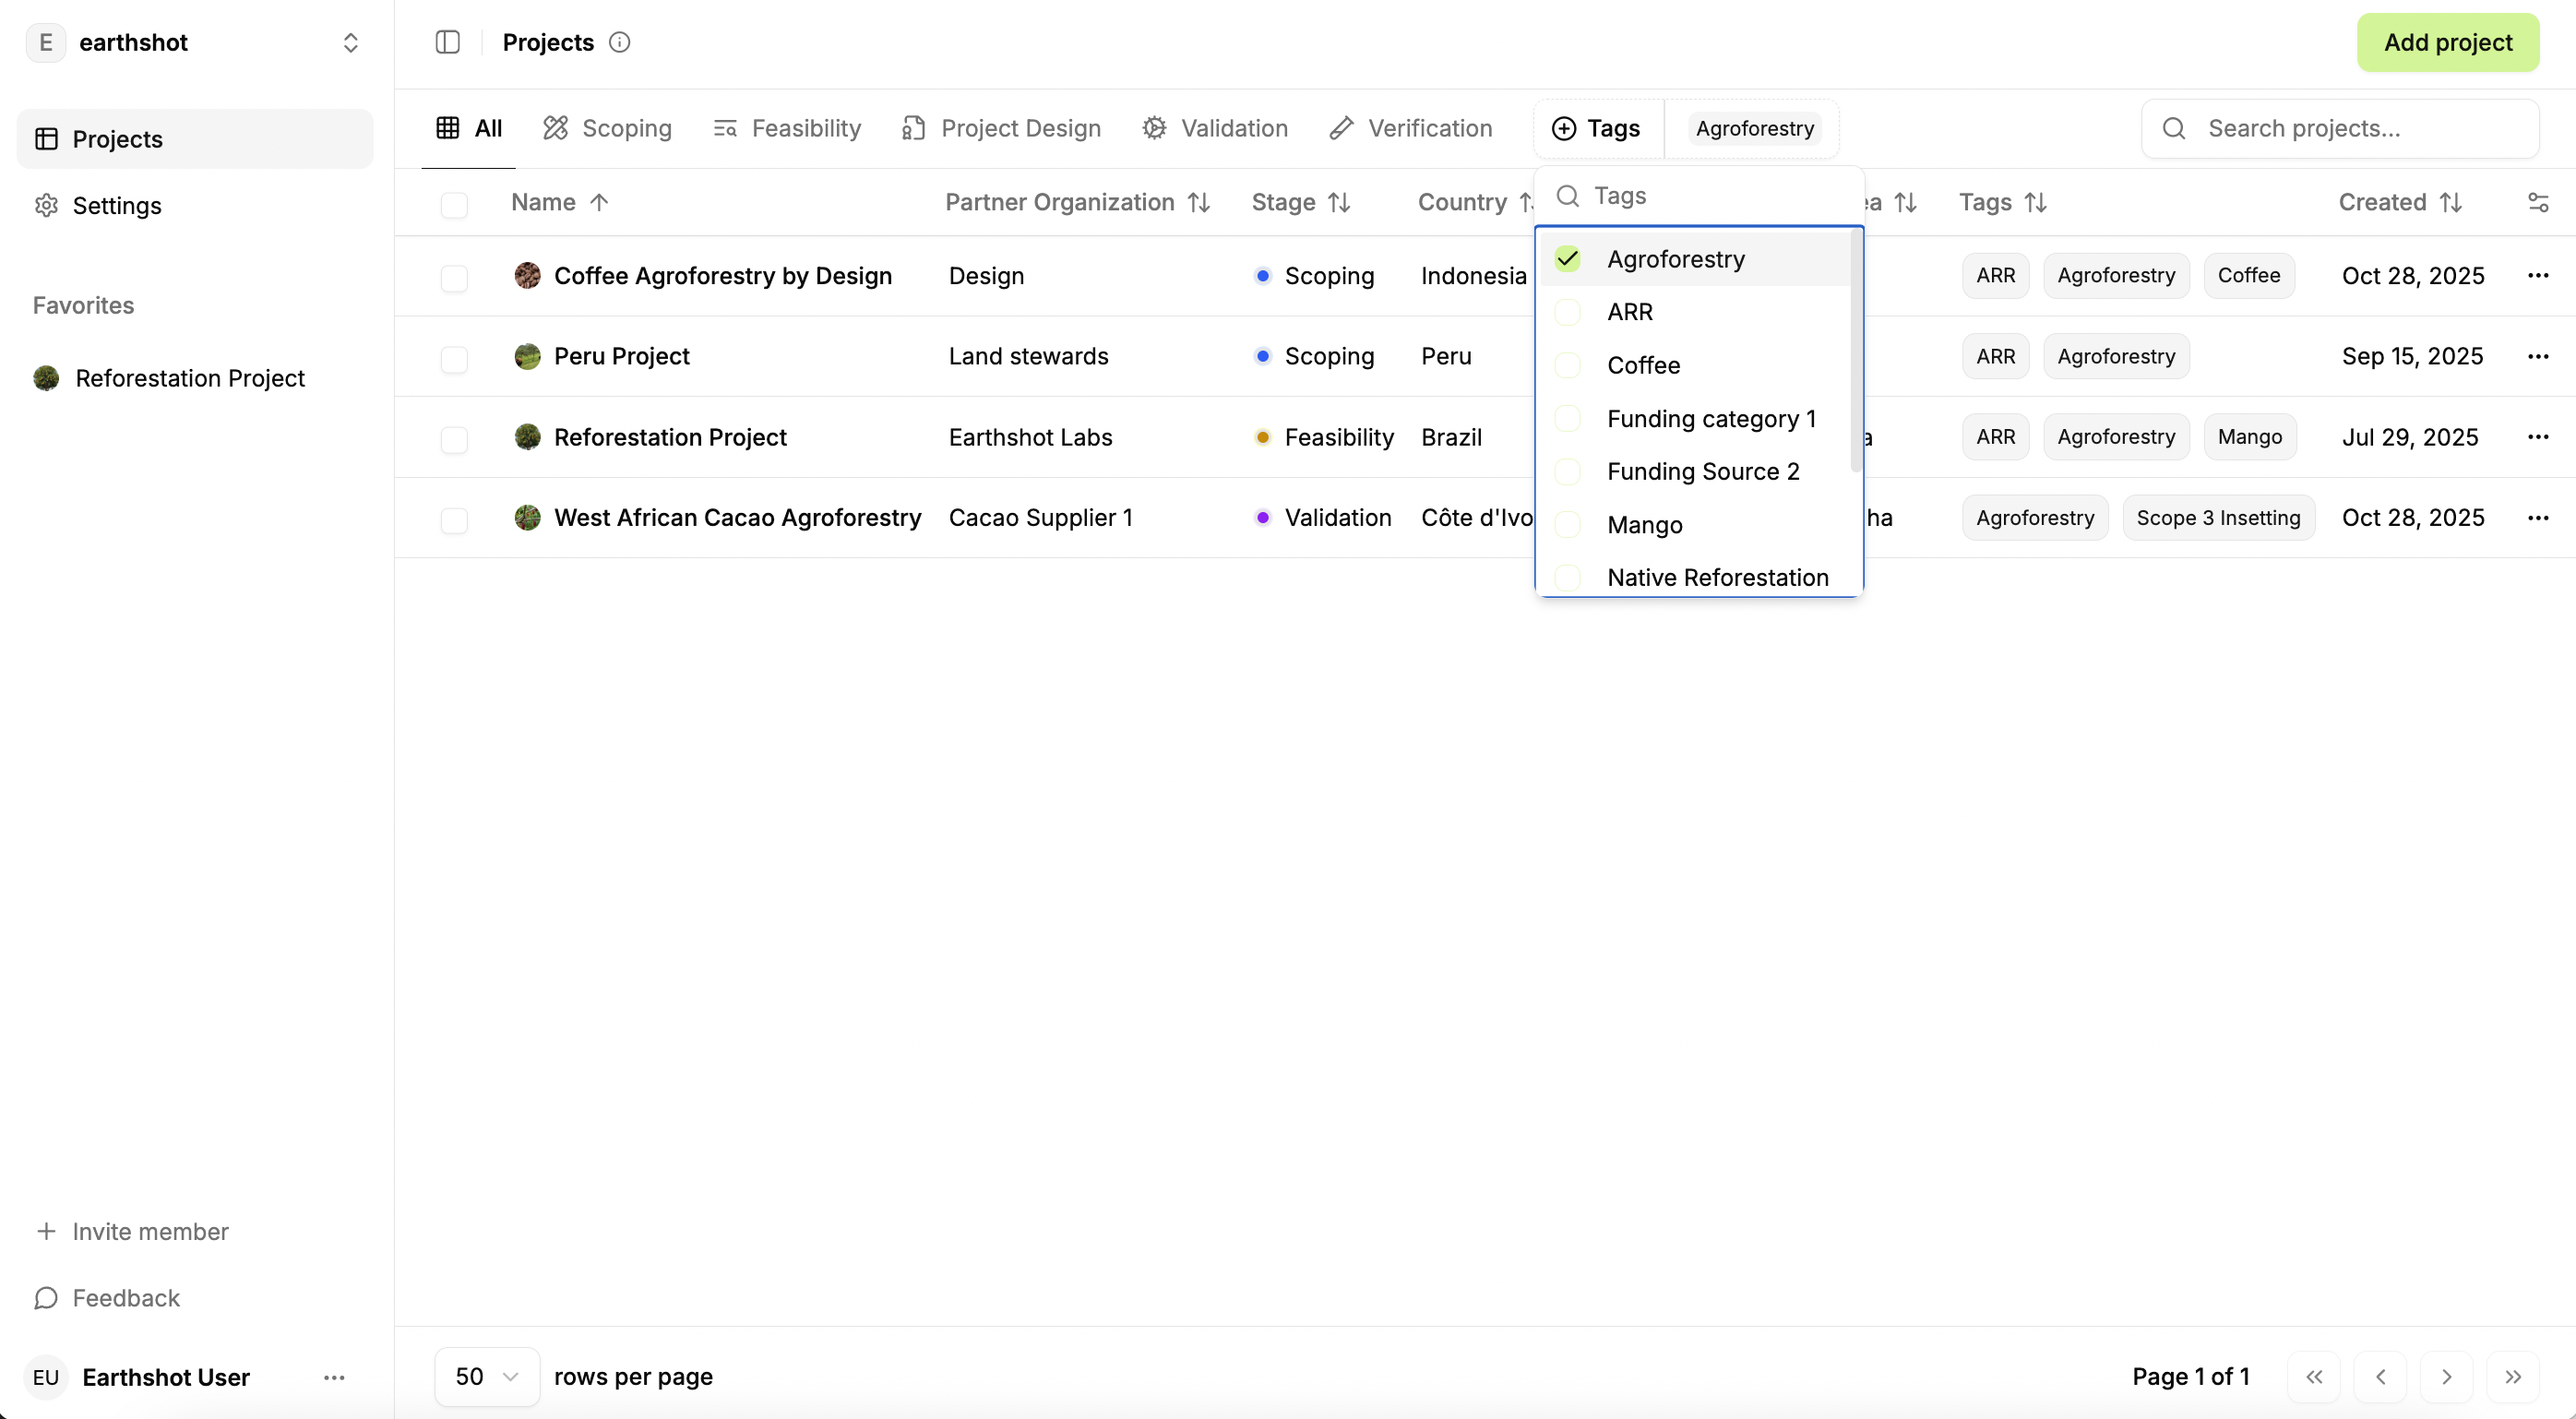
Each row shows key project information, including project stage (scoping, feasibility, project design, validation, verification) and custom tags that help you track project types (e.g. ARR, REDD+, funding source, portfolio group). You can filter the Projects Table using these tags, and you can also see basic details such as total polygon area and creation date.
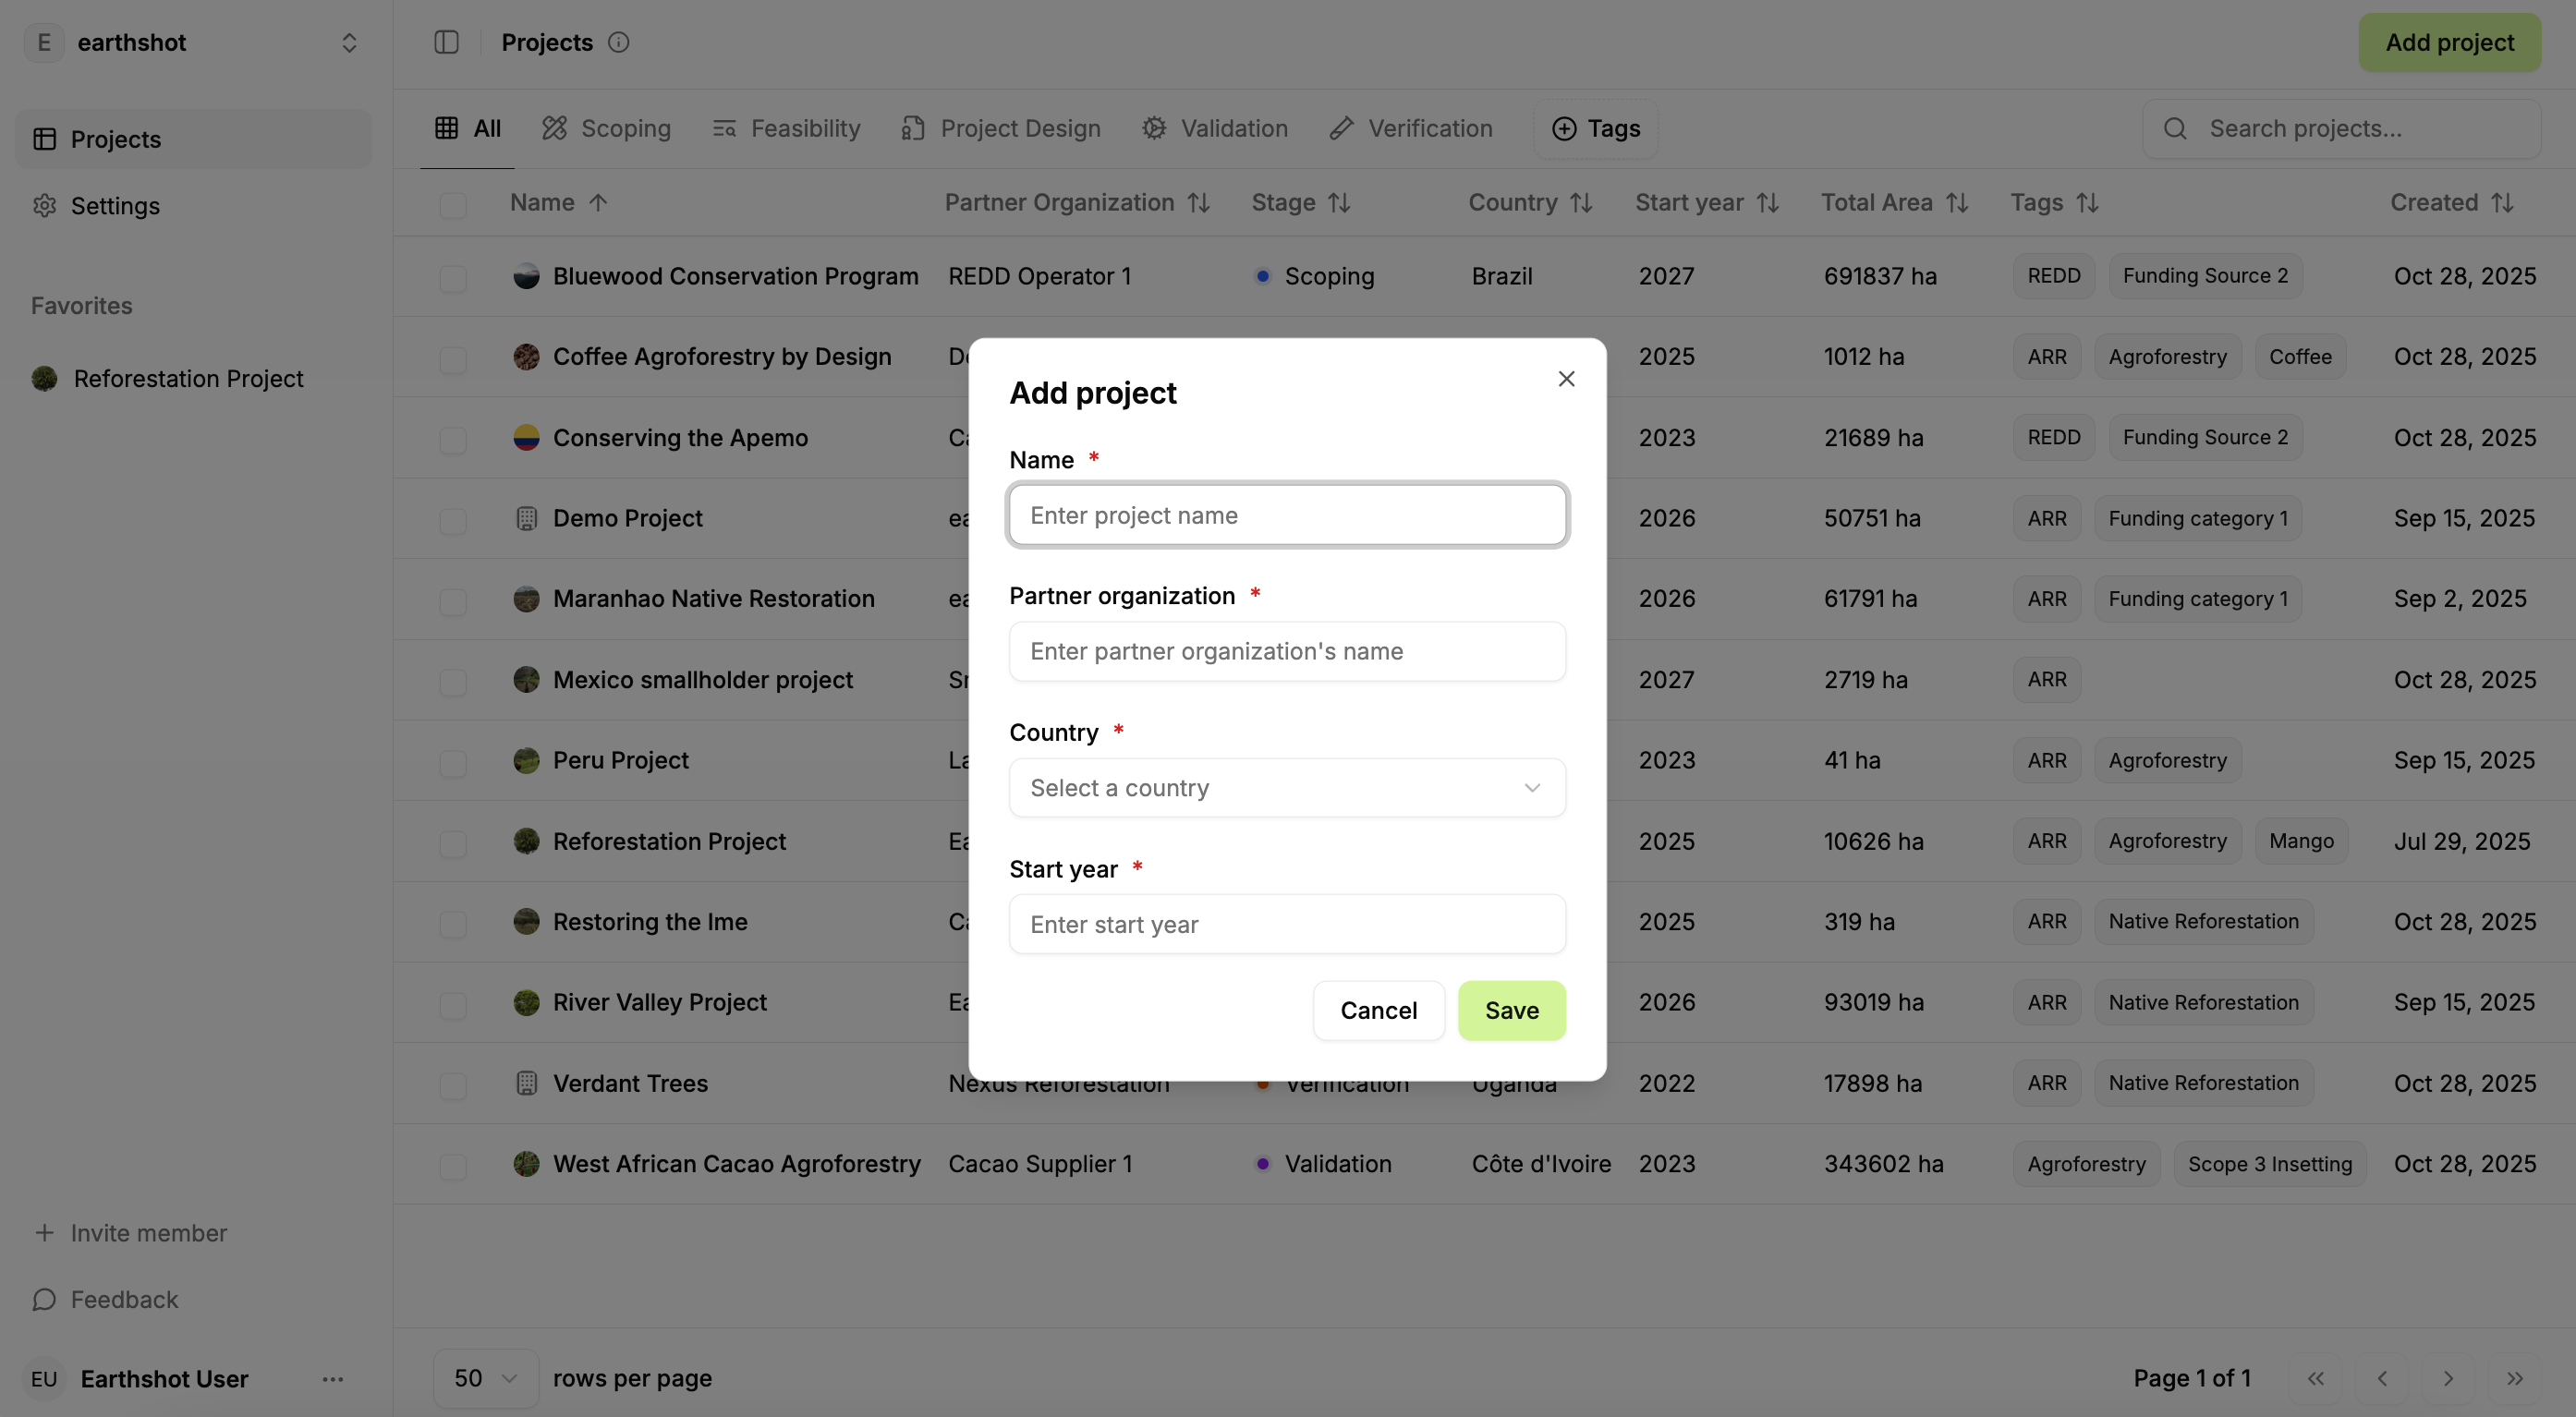
To create a new project, click the “Add Project” button in the top-right corner.
Project
Inside a project
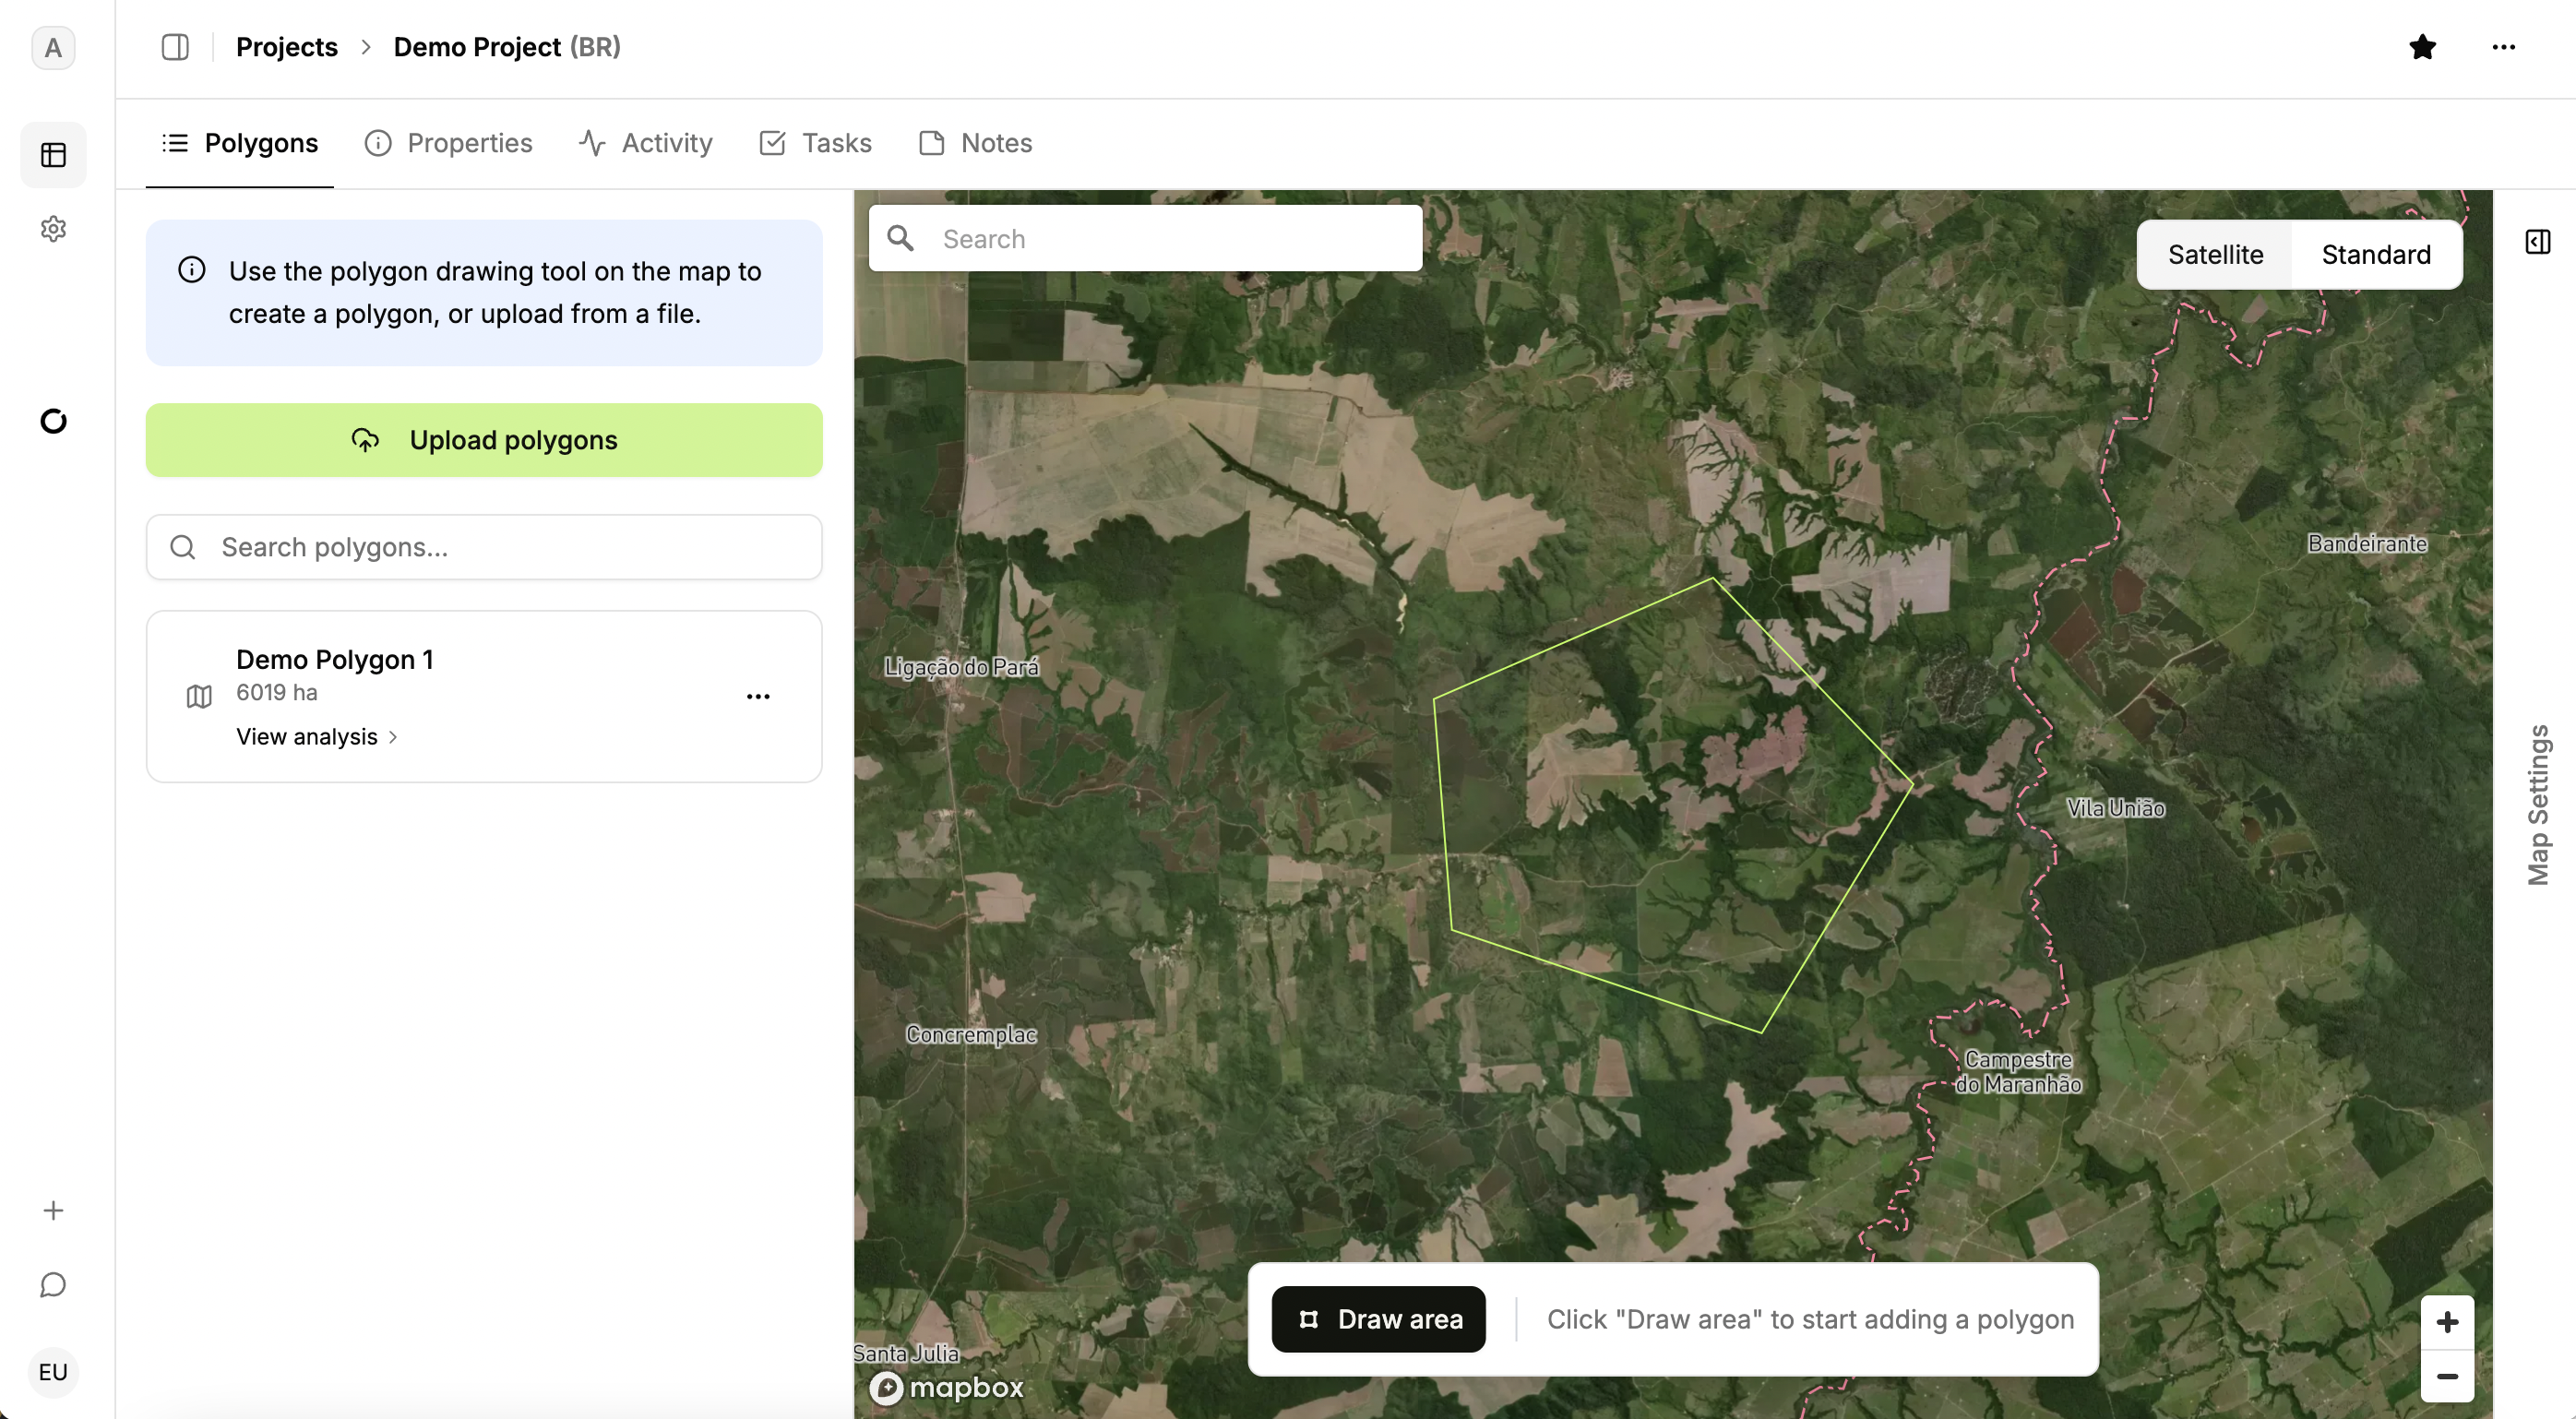
Within a Project, use the tabs above the map to move between Polygons, Properties, Activity, Tasks, and Notes. These views together provide the core project management tools.
In the Polygons tab, you can add project areas by uploading polygons or drawing them directly on the map. A Project can include multiple polygons, and each polygon appears in the left panel after it is added.
Tip: You can use the draw tool to create multipolygons by drawing more than one polygon before saving.
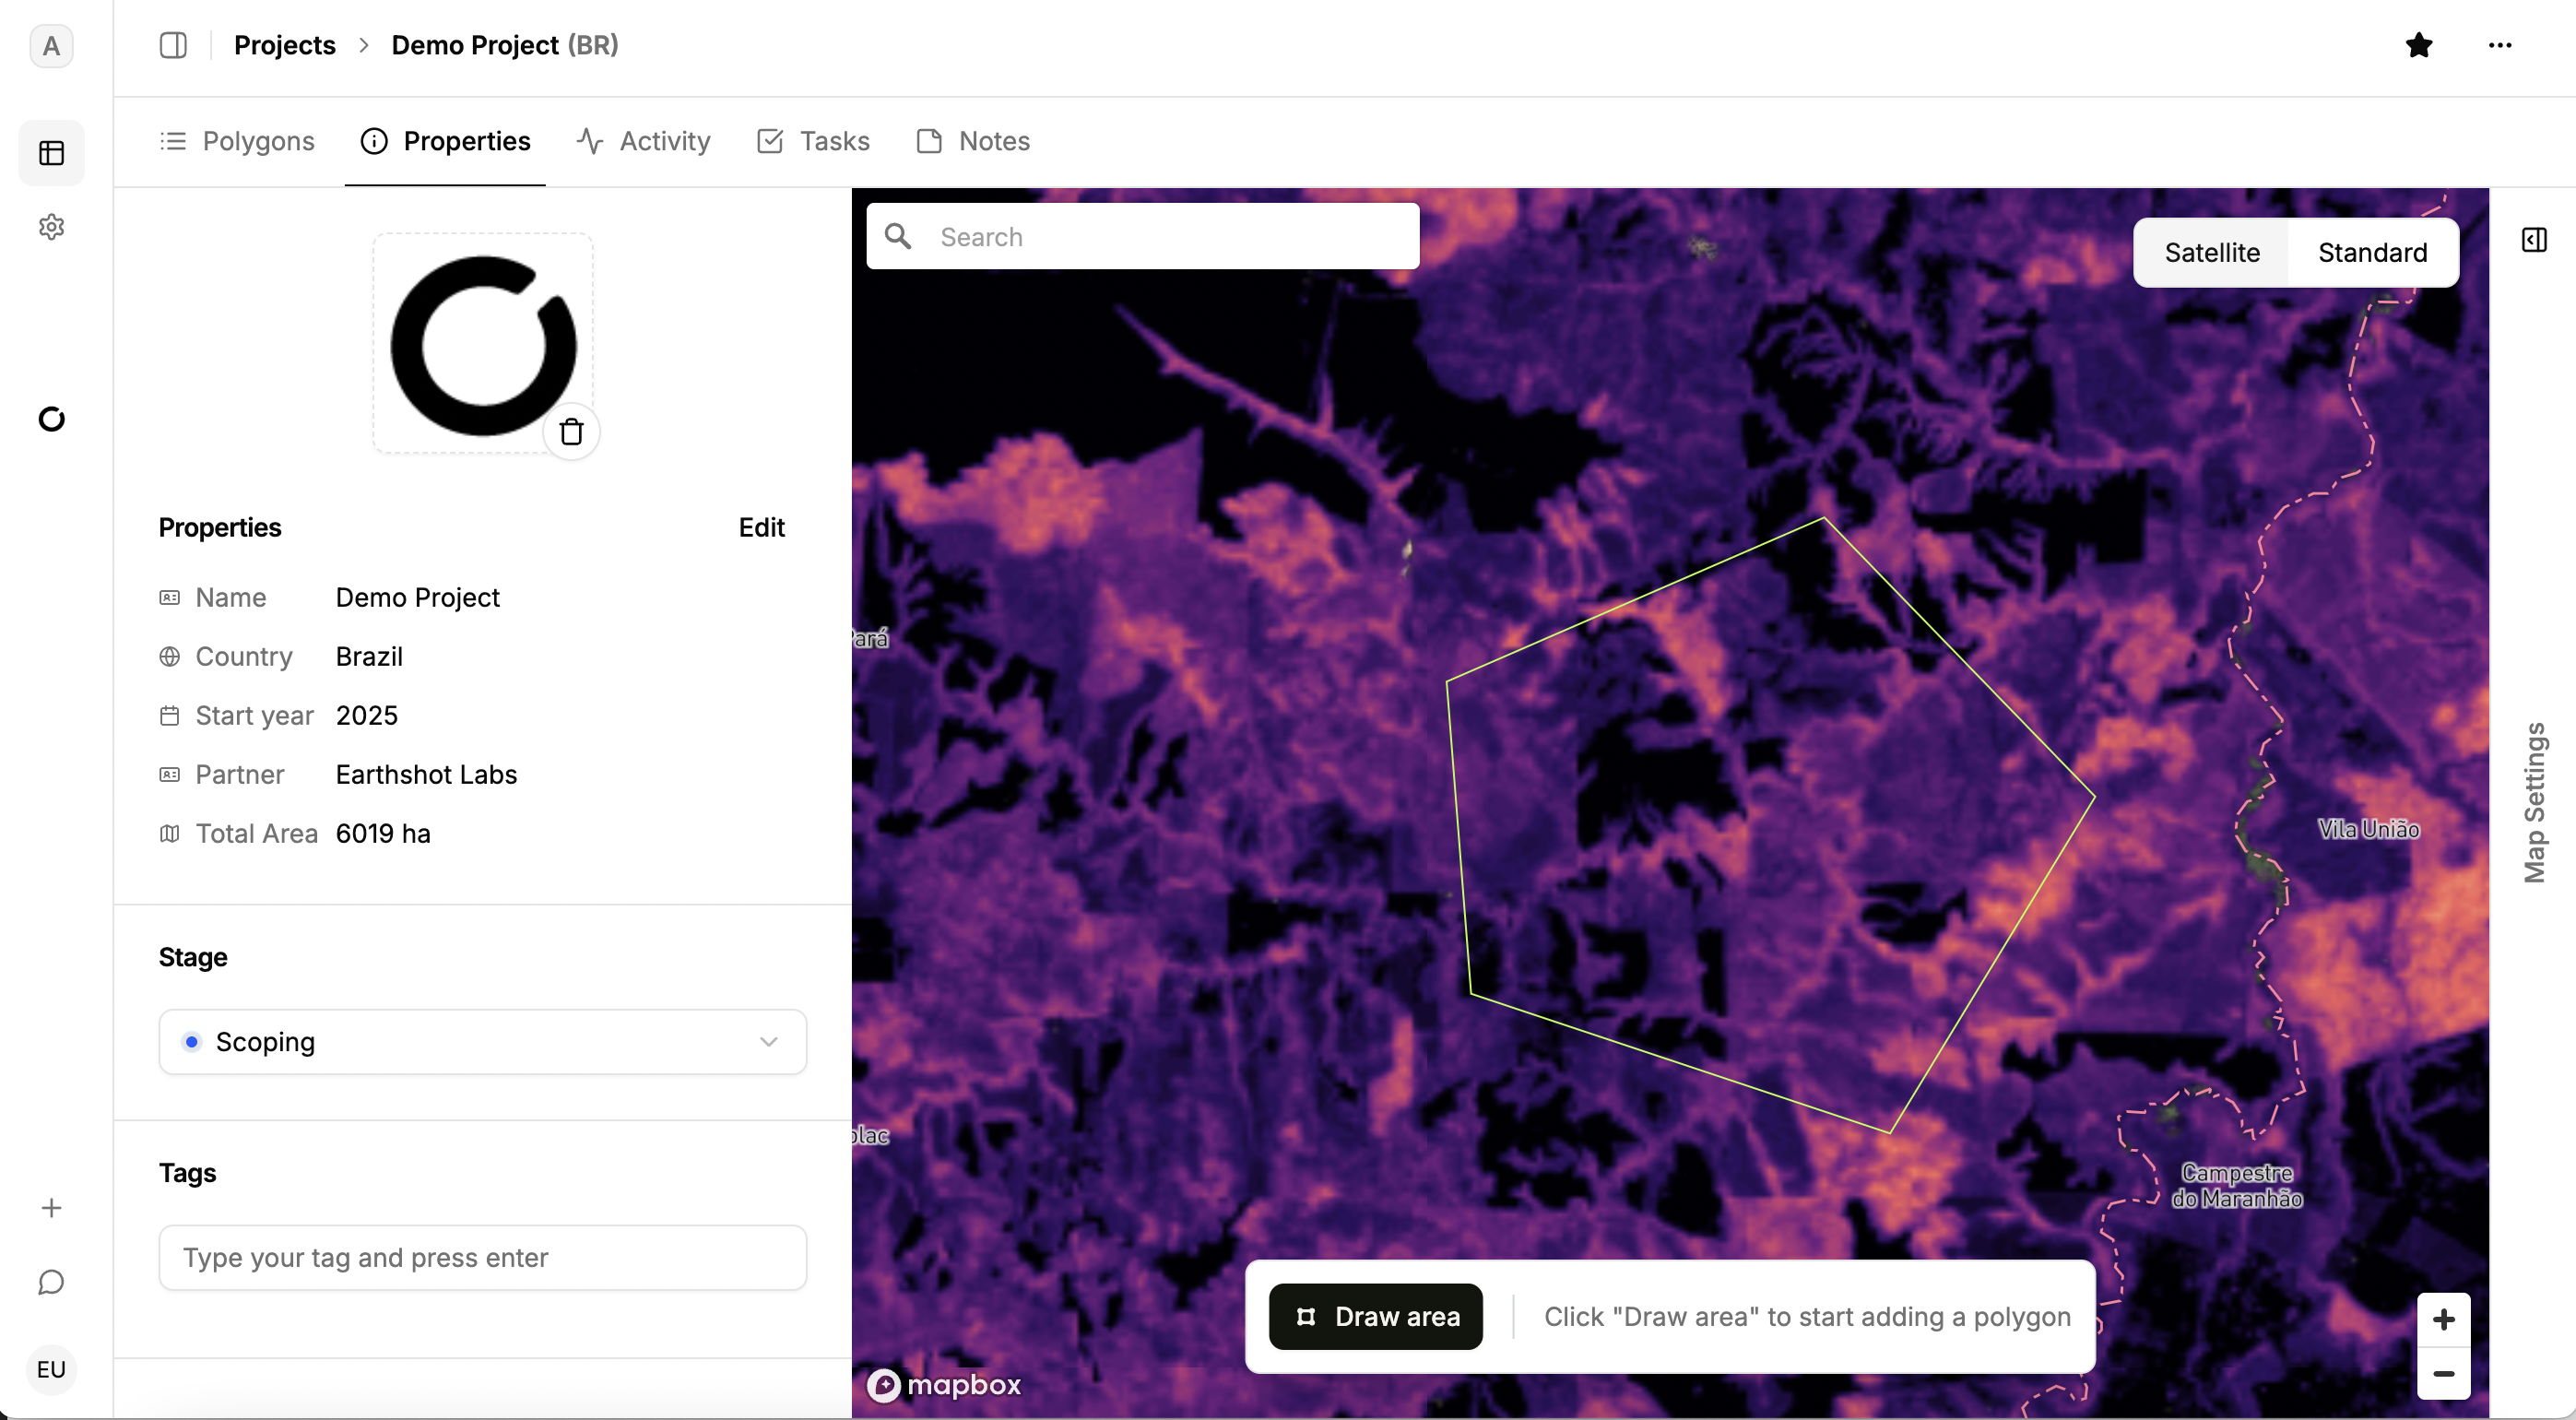
Project properties
Every Project has Properties. Here you can set an icon to help identify the project the Projects table and edit summary details such as name, country, start year, partner, and total polygon area. You can also update the project stage and manage the custom tags that appear in the Projects table.
Tip: to see more project information, collapse the account controls on the left using the collapse icon.
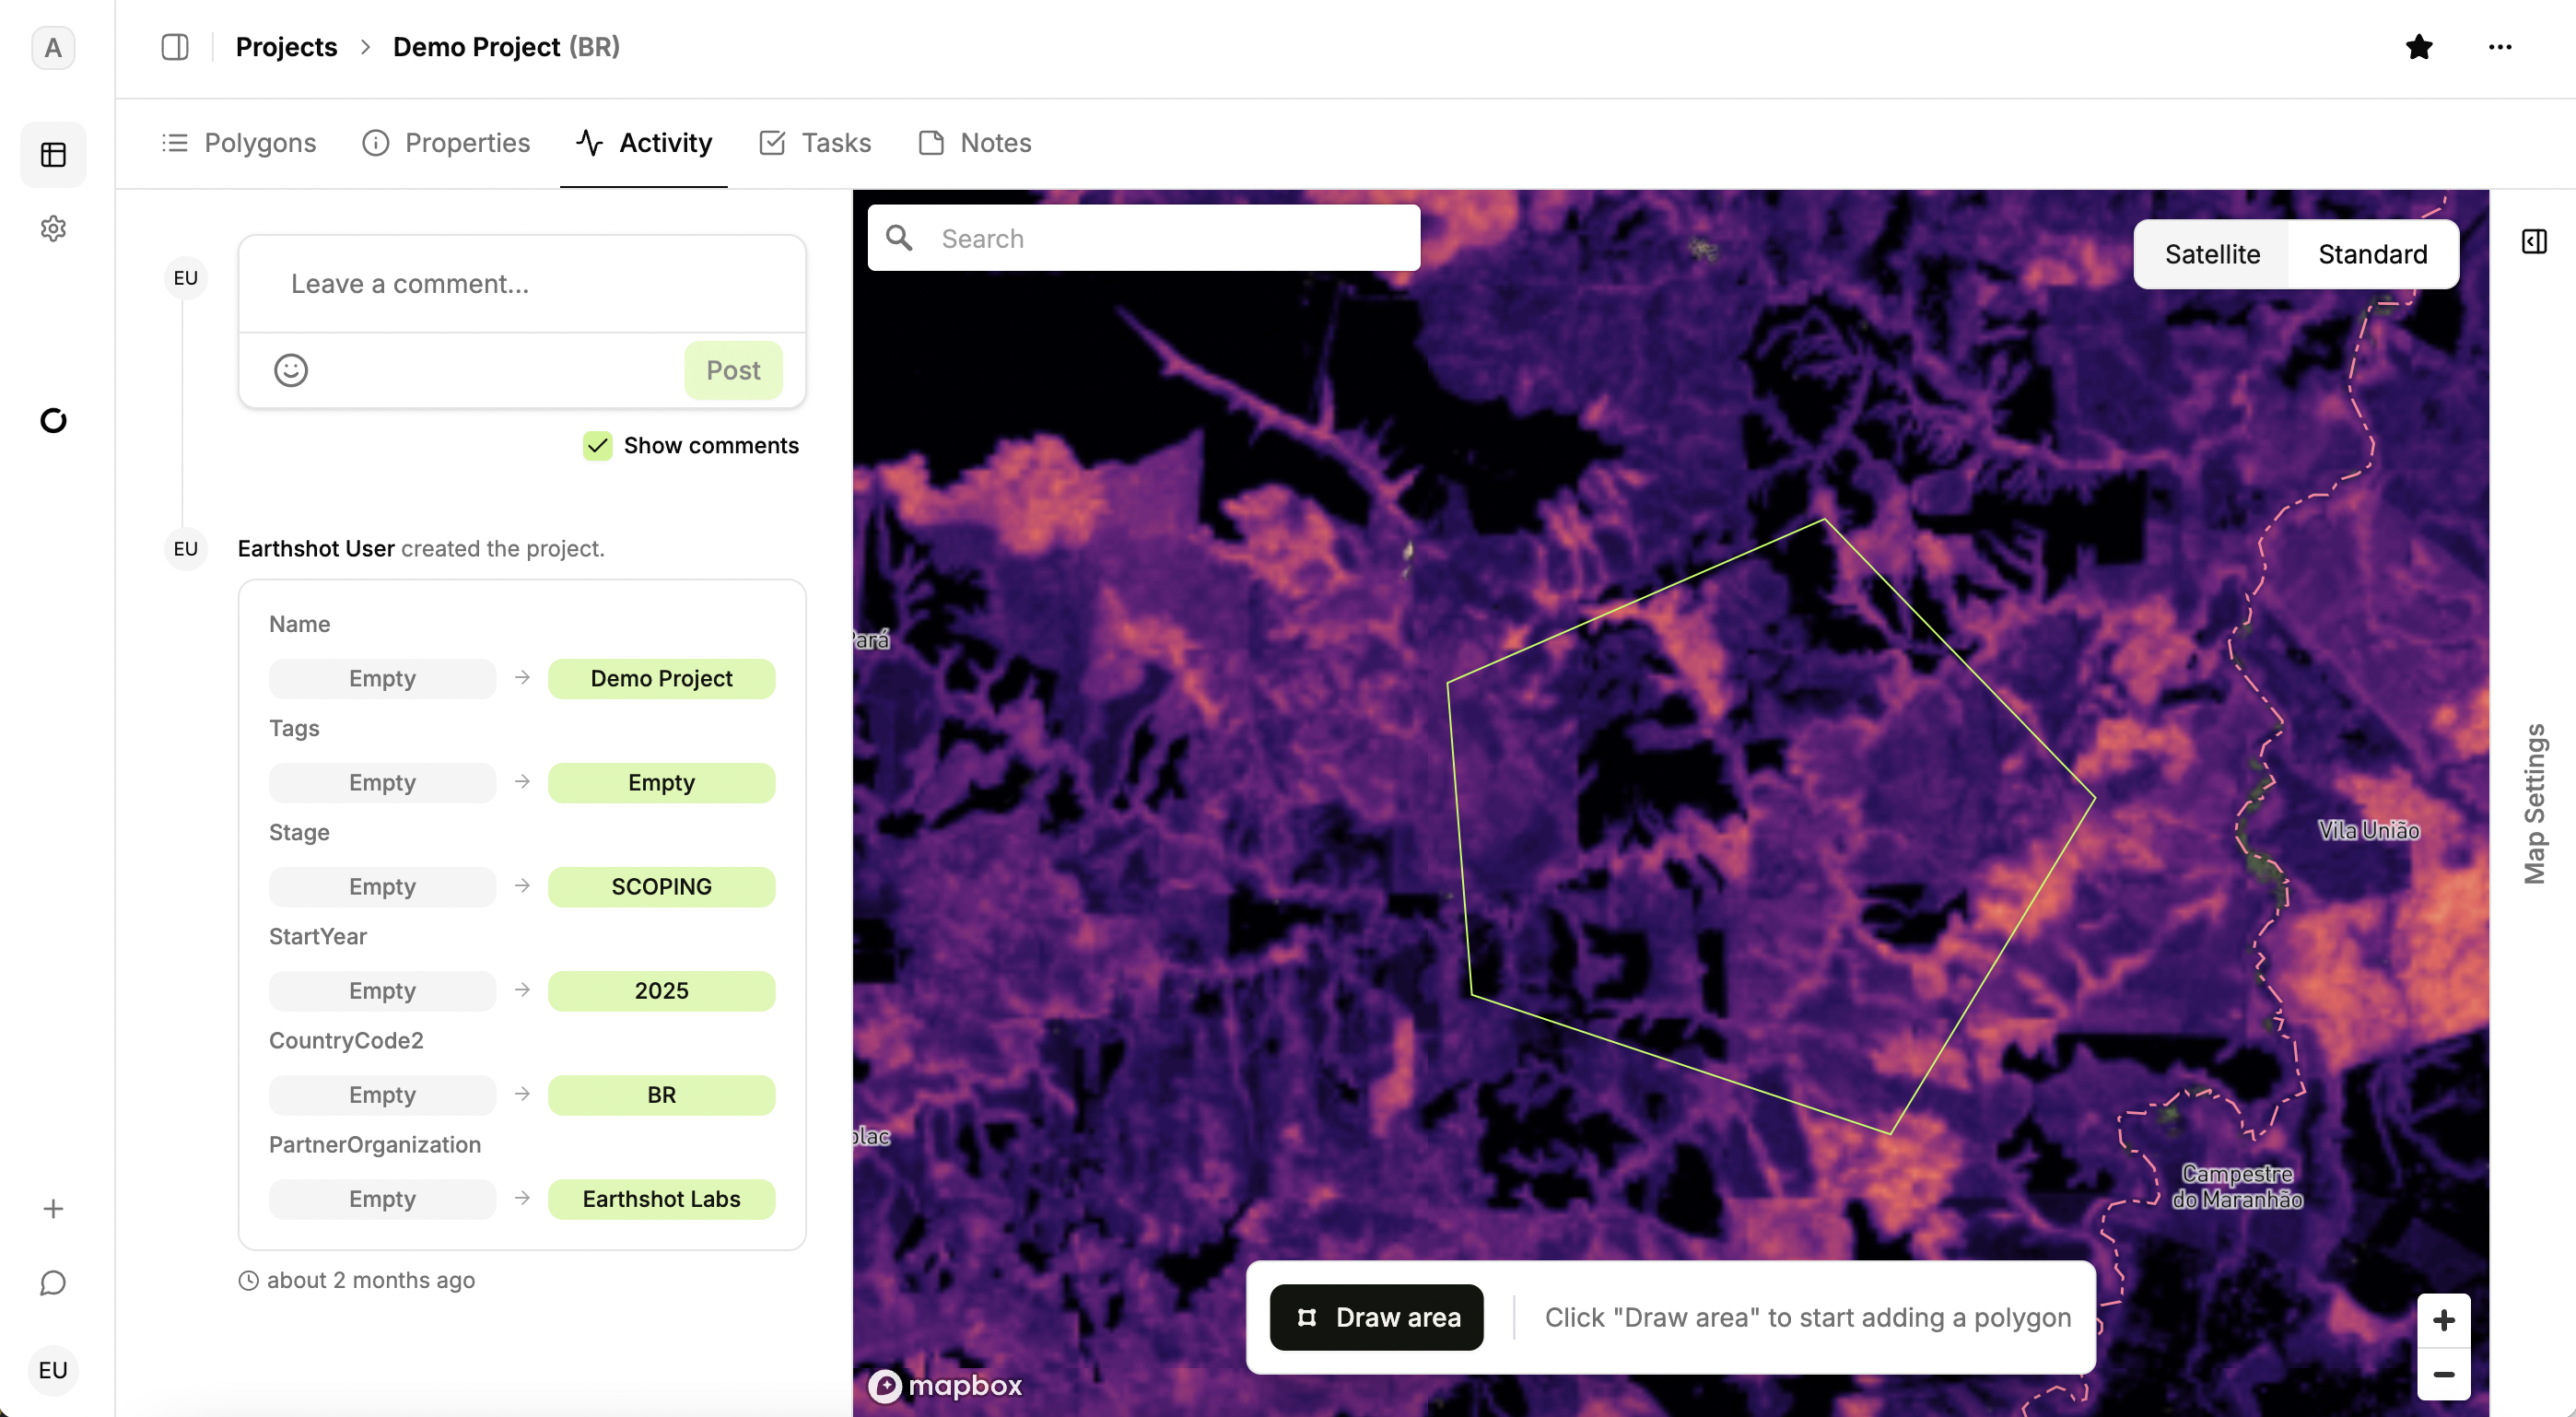
Activity, tasks, and notes
The Activity tab shows a history of changes in the project, including what was changed and by whom.
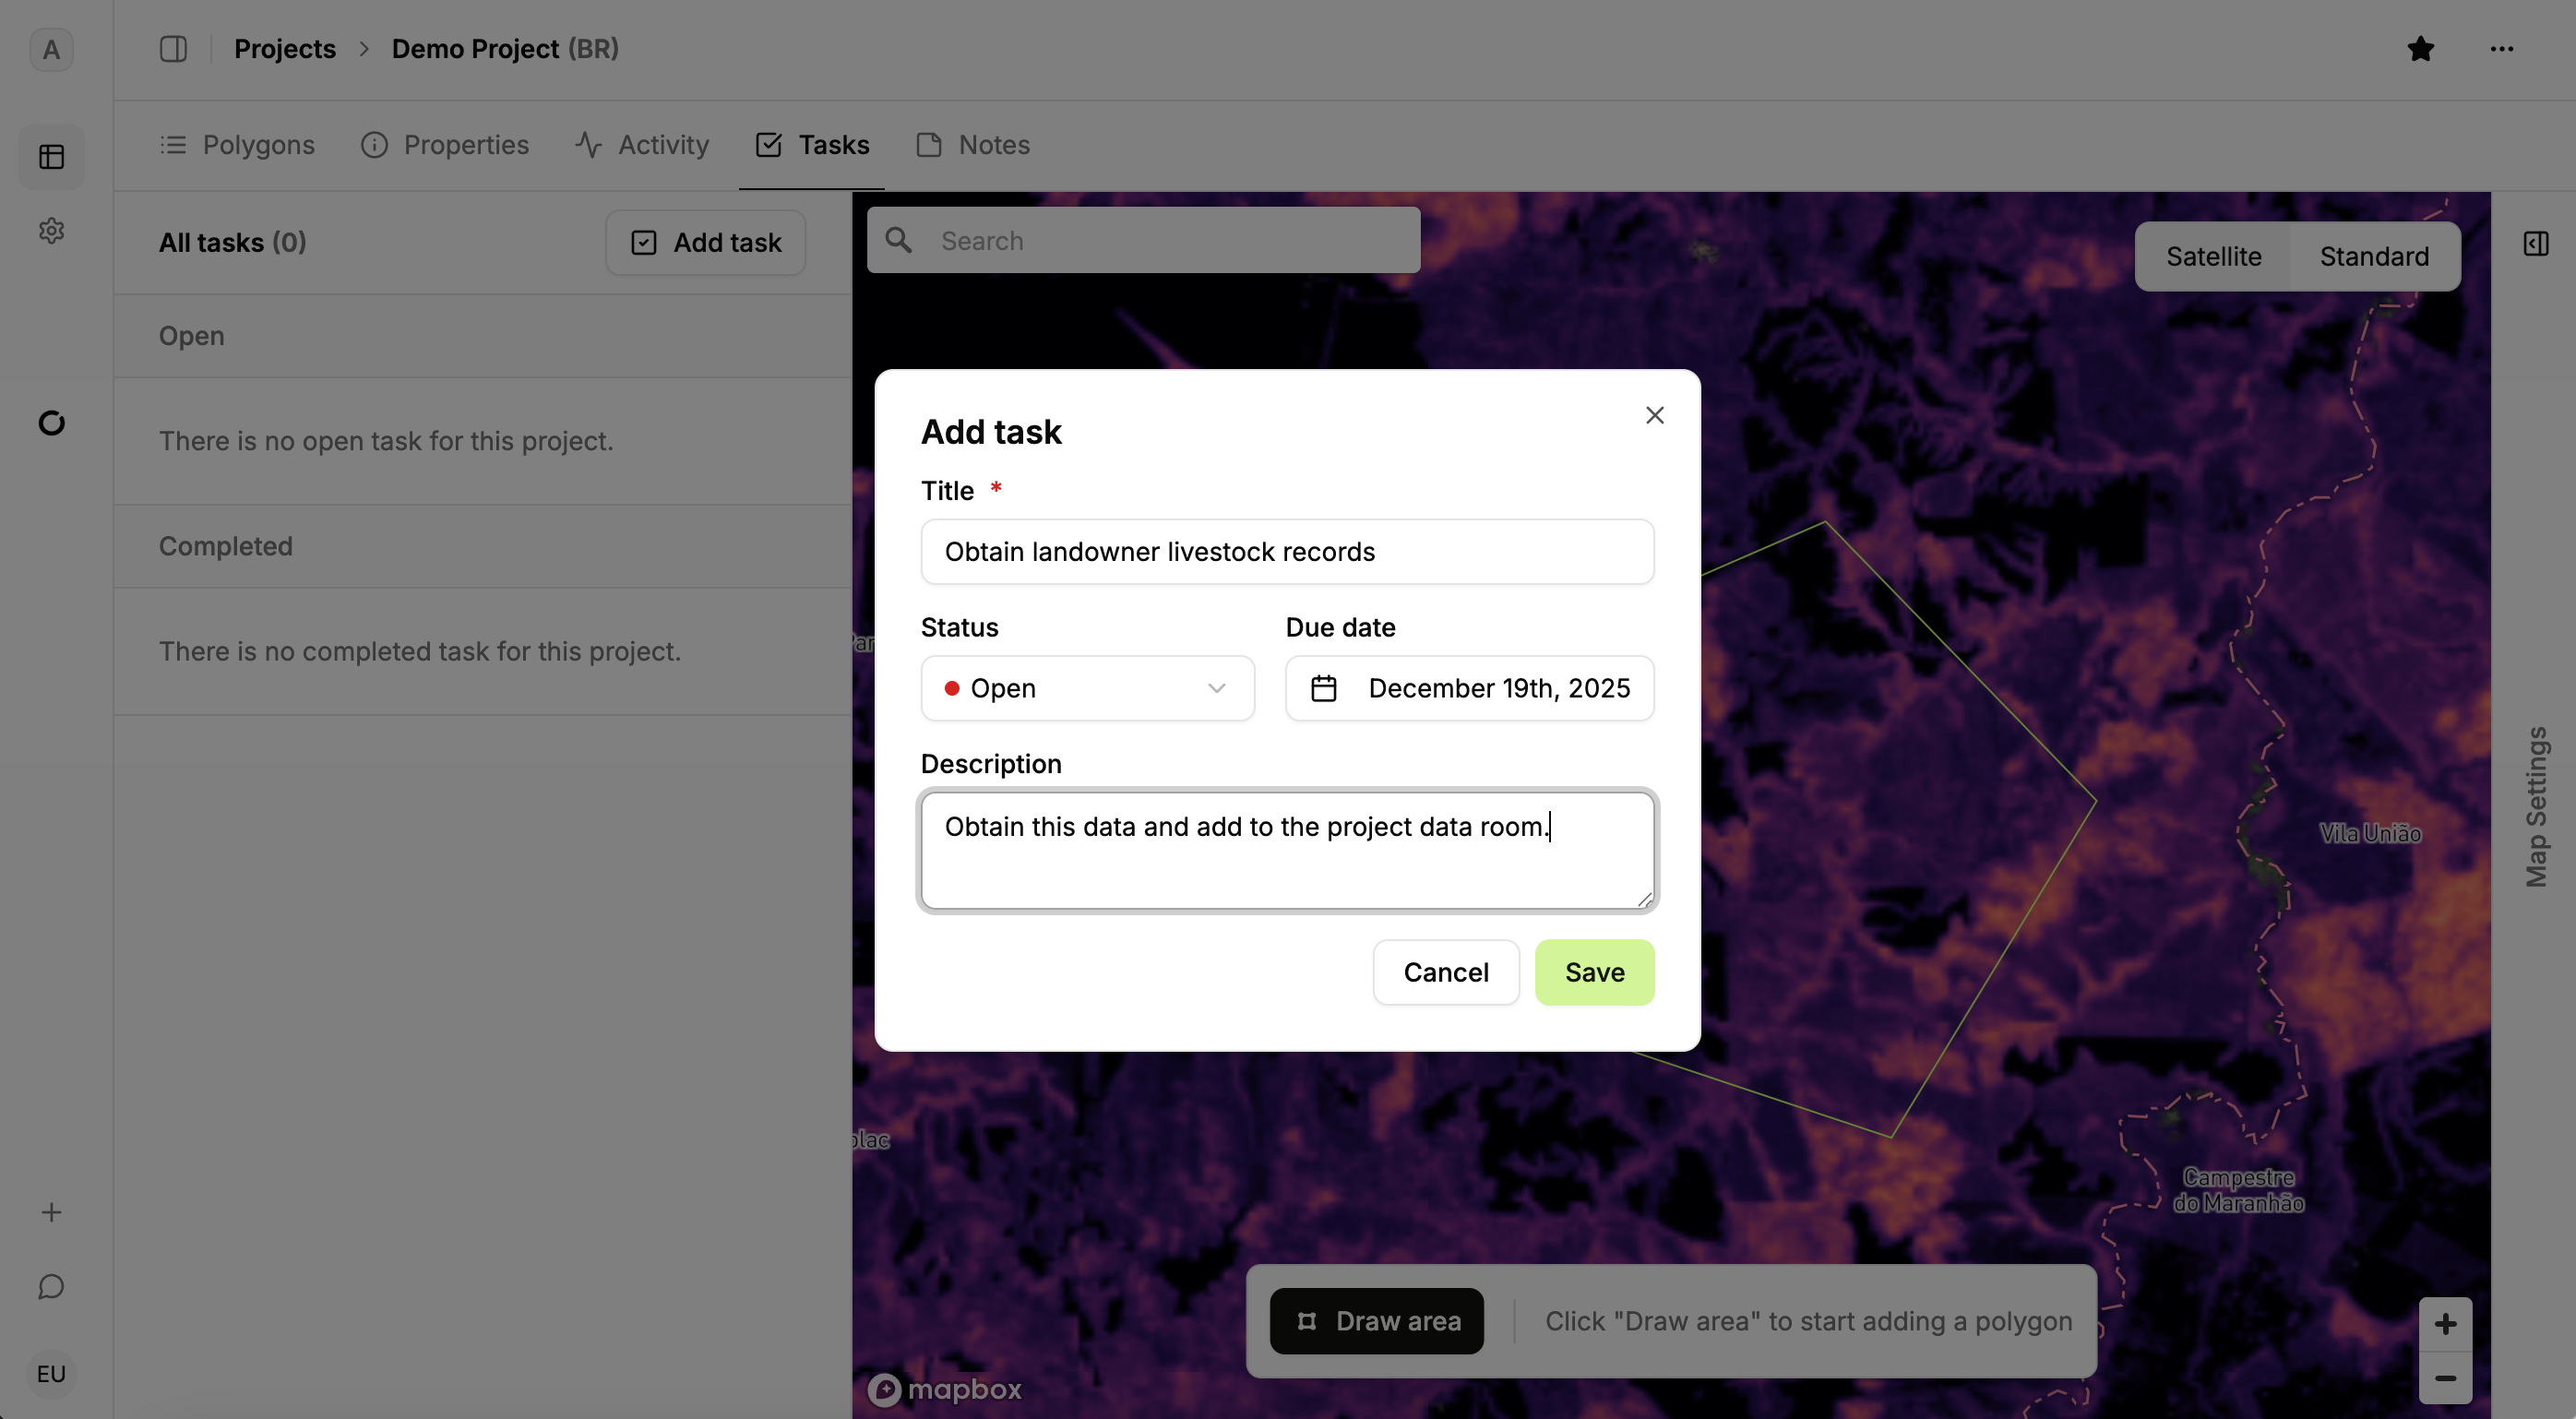
Use the Tasks tab to create and track tasks so you can coordinate work across your team.
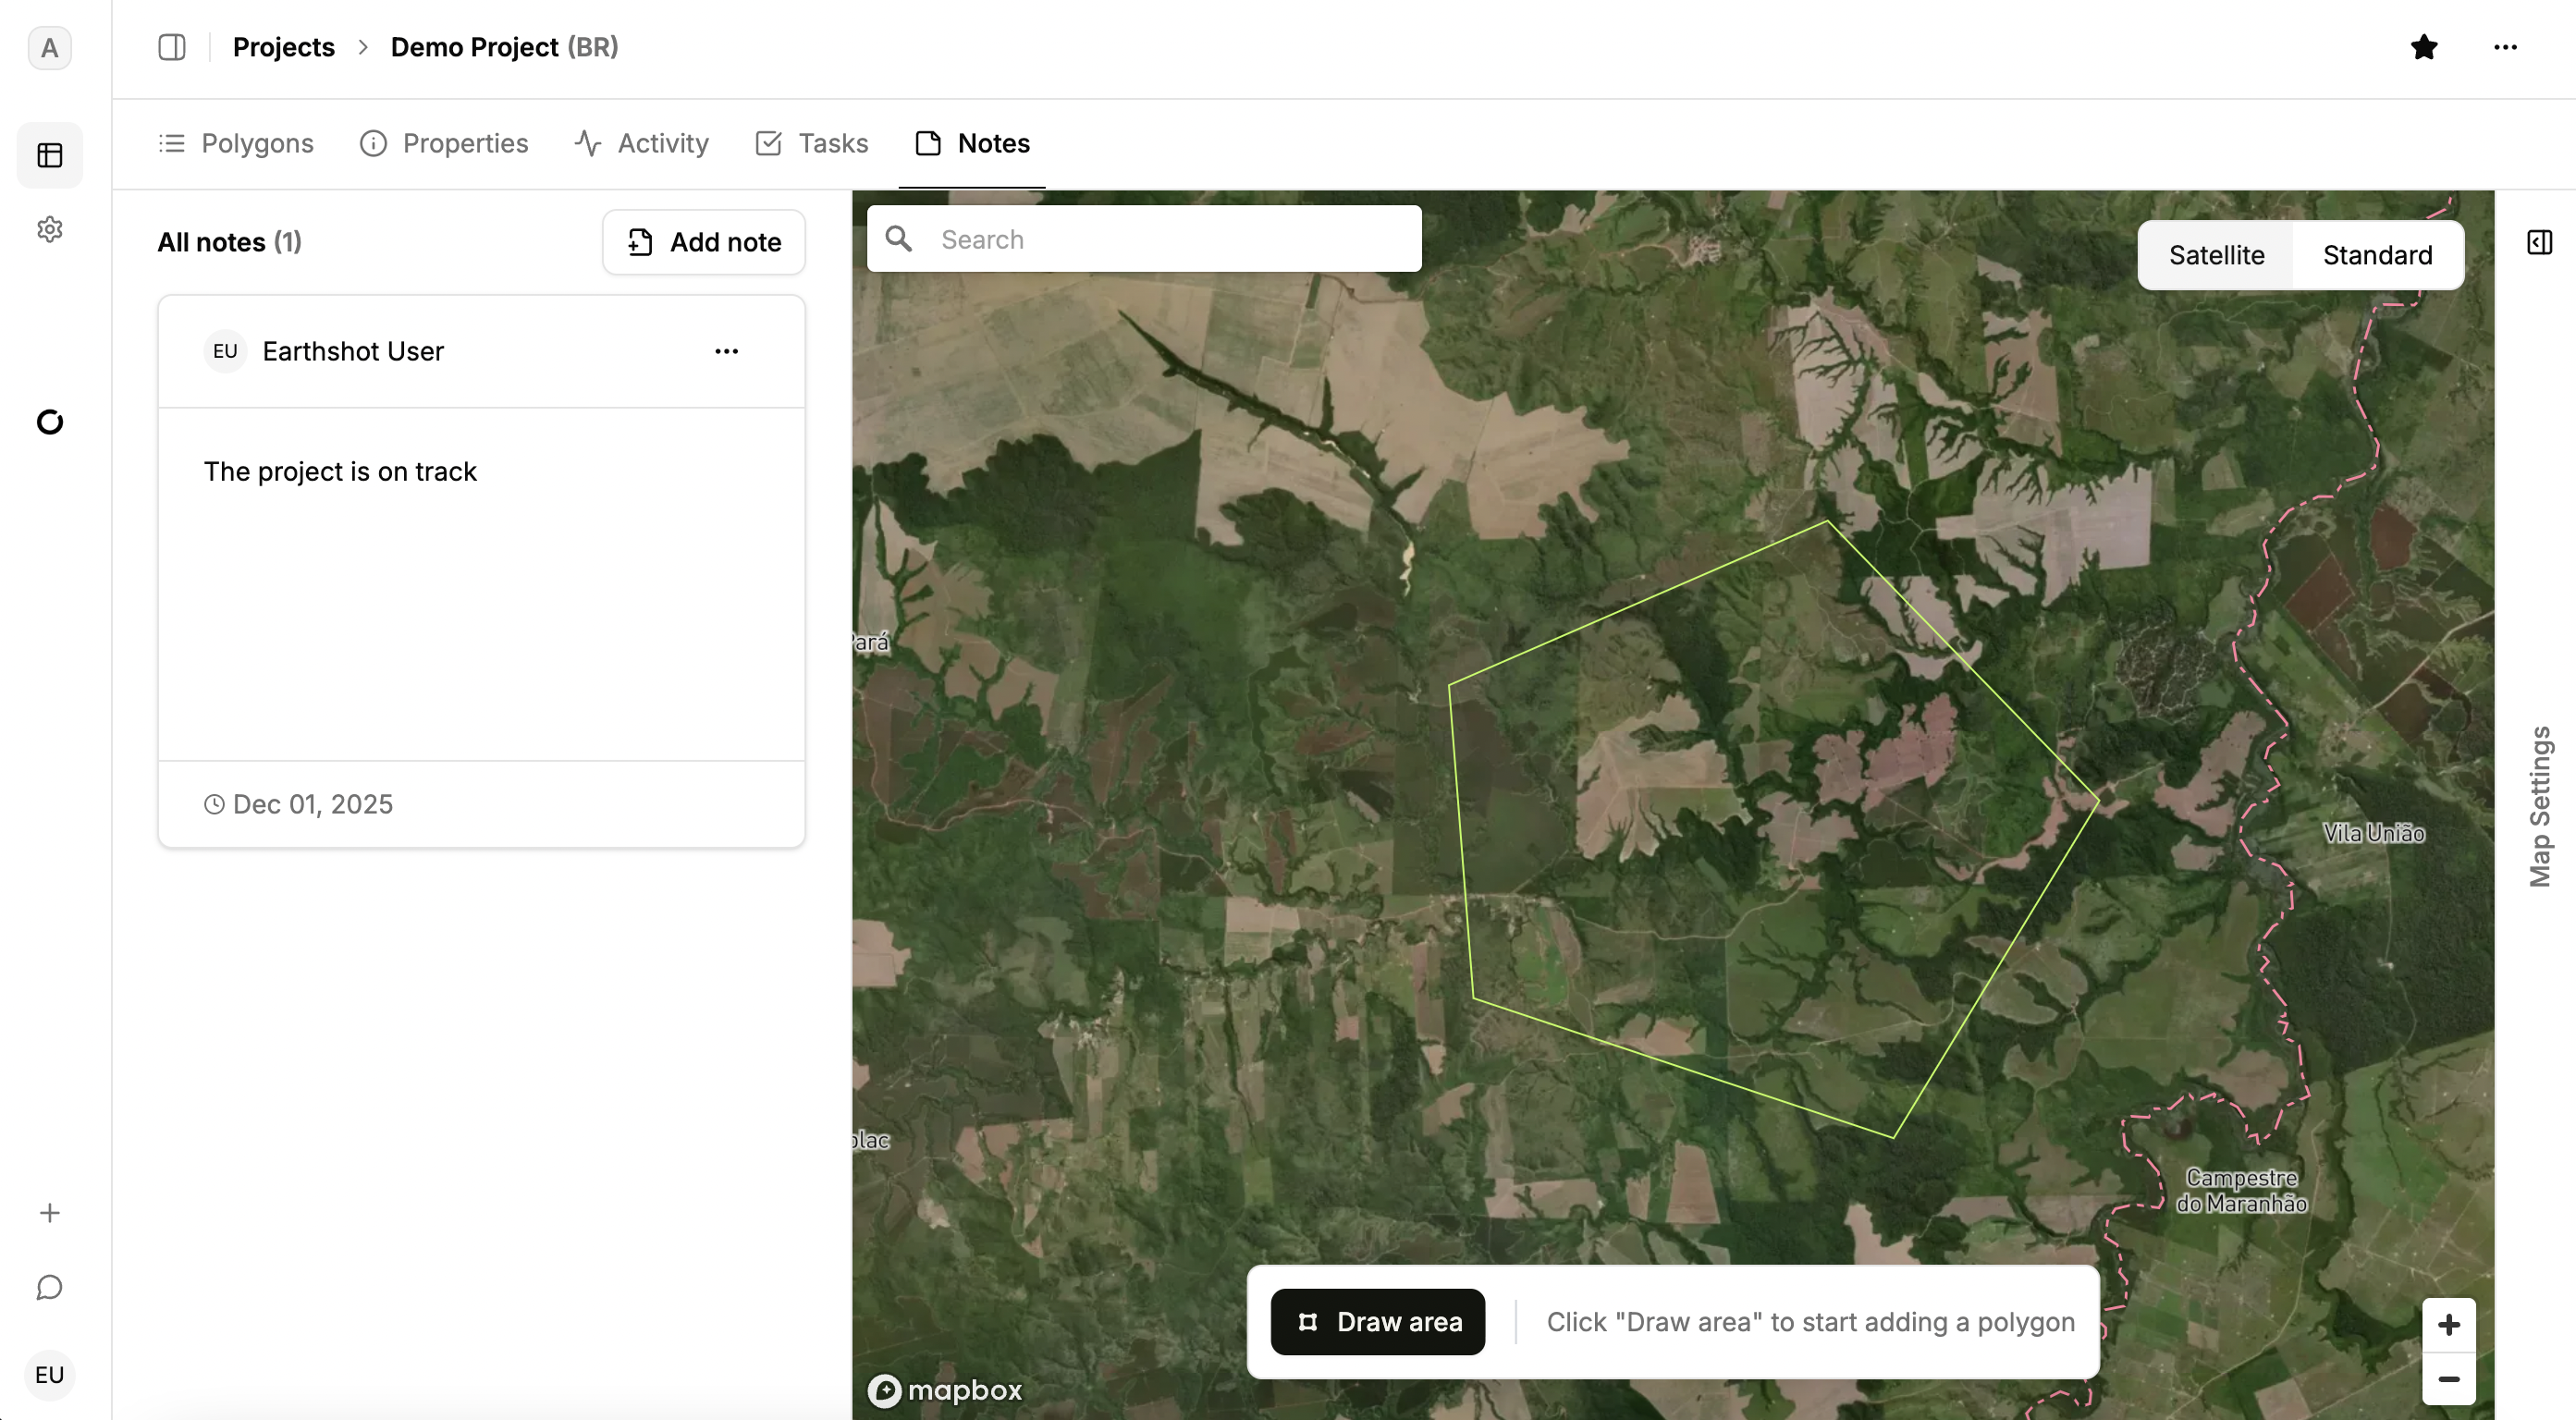
Use the Notes tab to capture additional project details and context in one place where your team can see them.
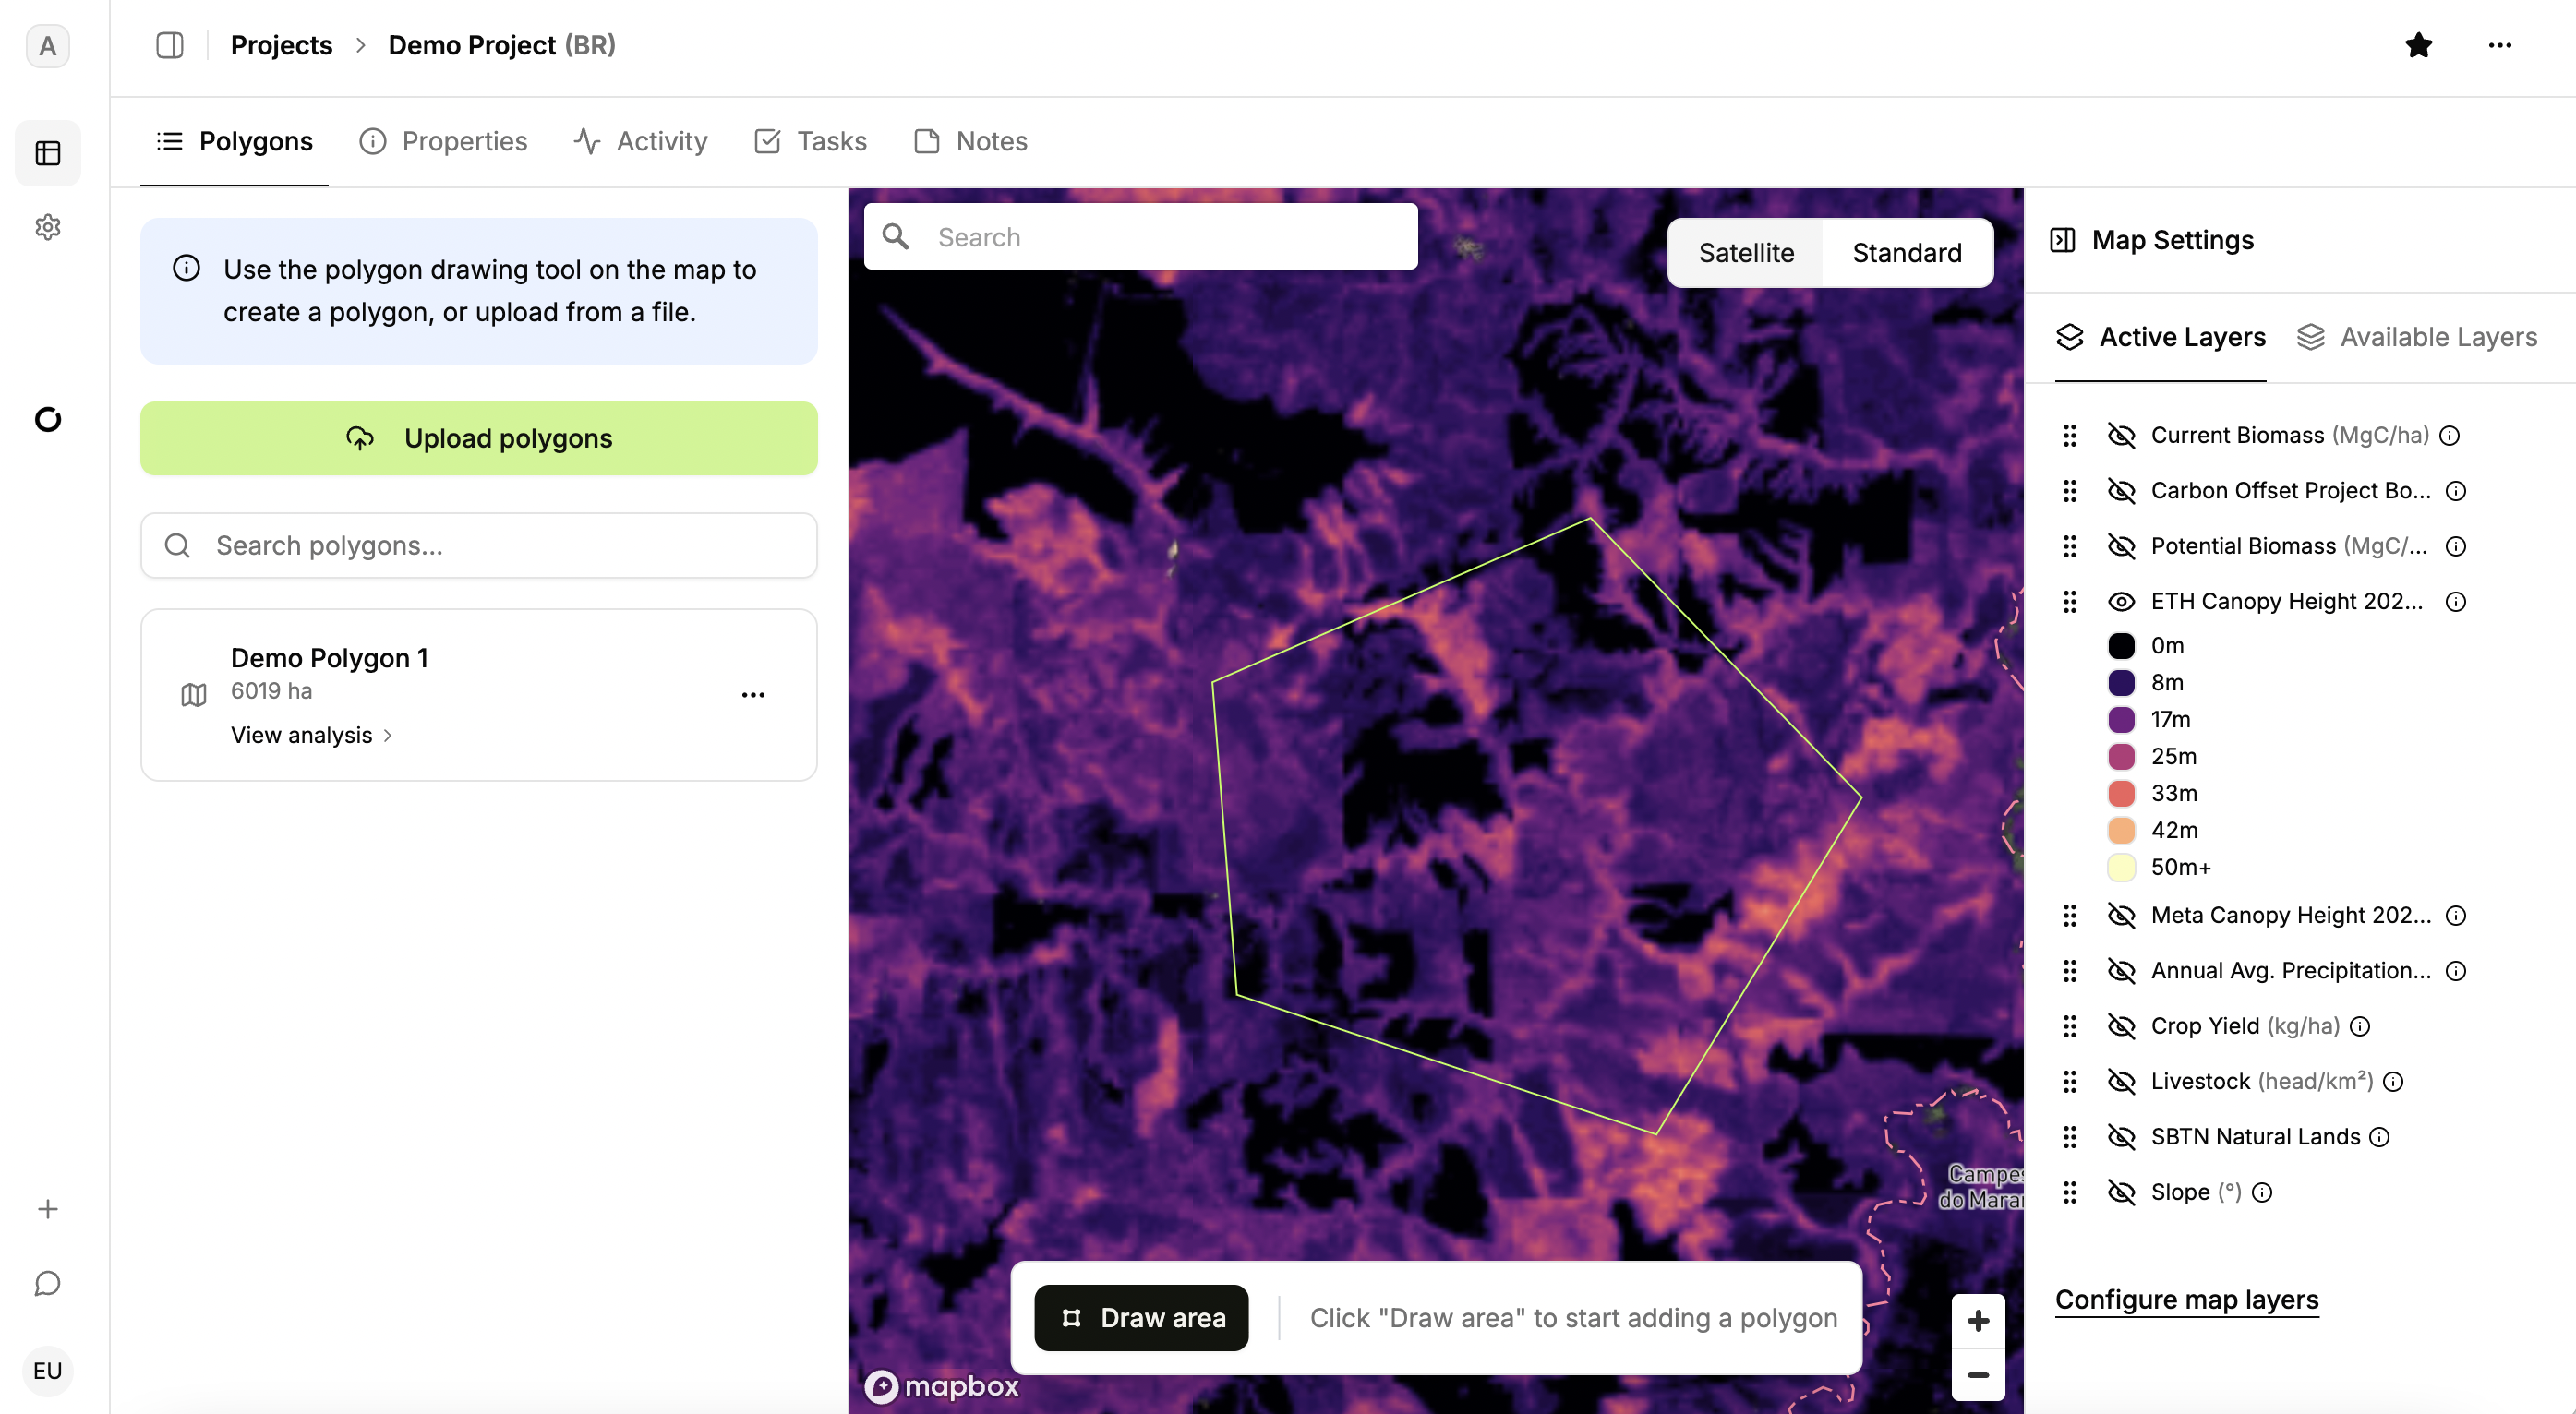
Map layers
Overlaying contextual maps on the project area is essential for understanding the land base, risks, and additional benefits your project can provide. LandOS includes an extensive catalog of map layers and you can request additional map layers by contacting us at support@earthshot.eco.
Use the map drawer on the right side of the screen to turn map layers on or off and adjust their settings..
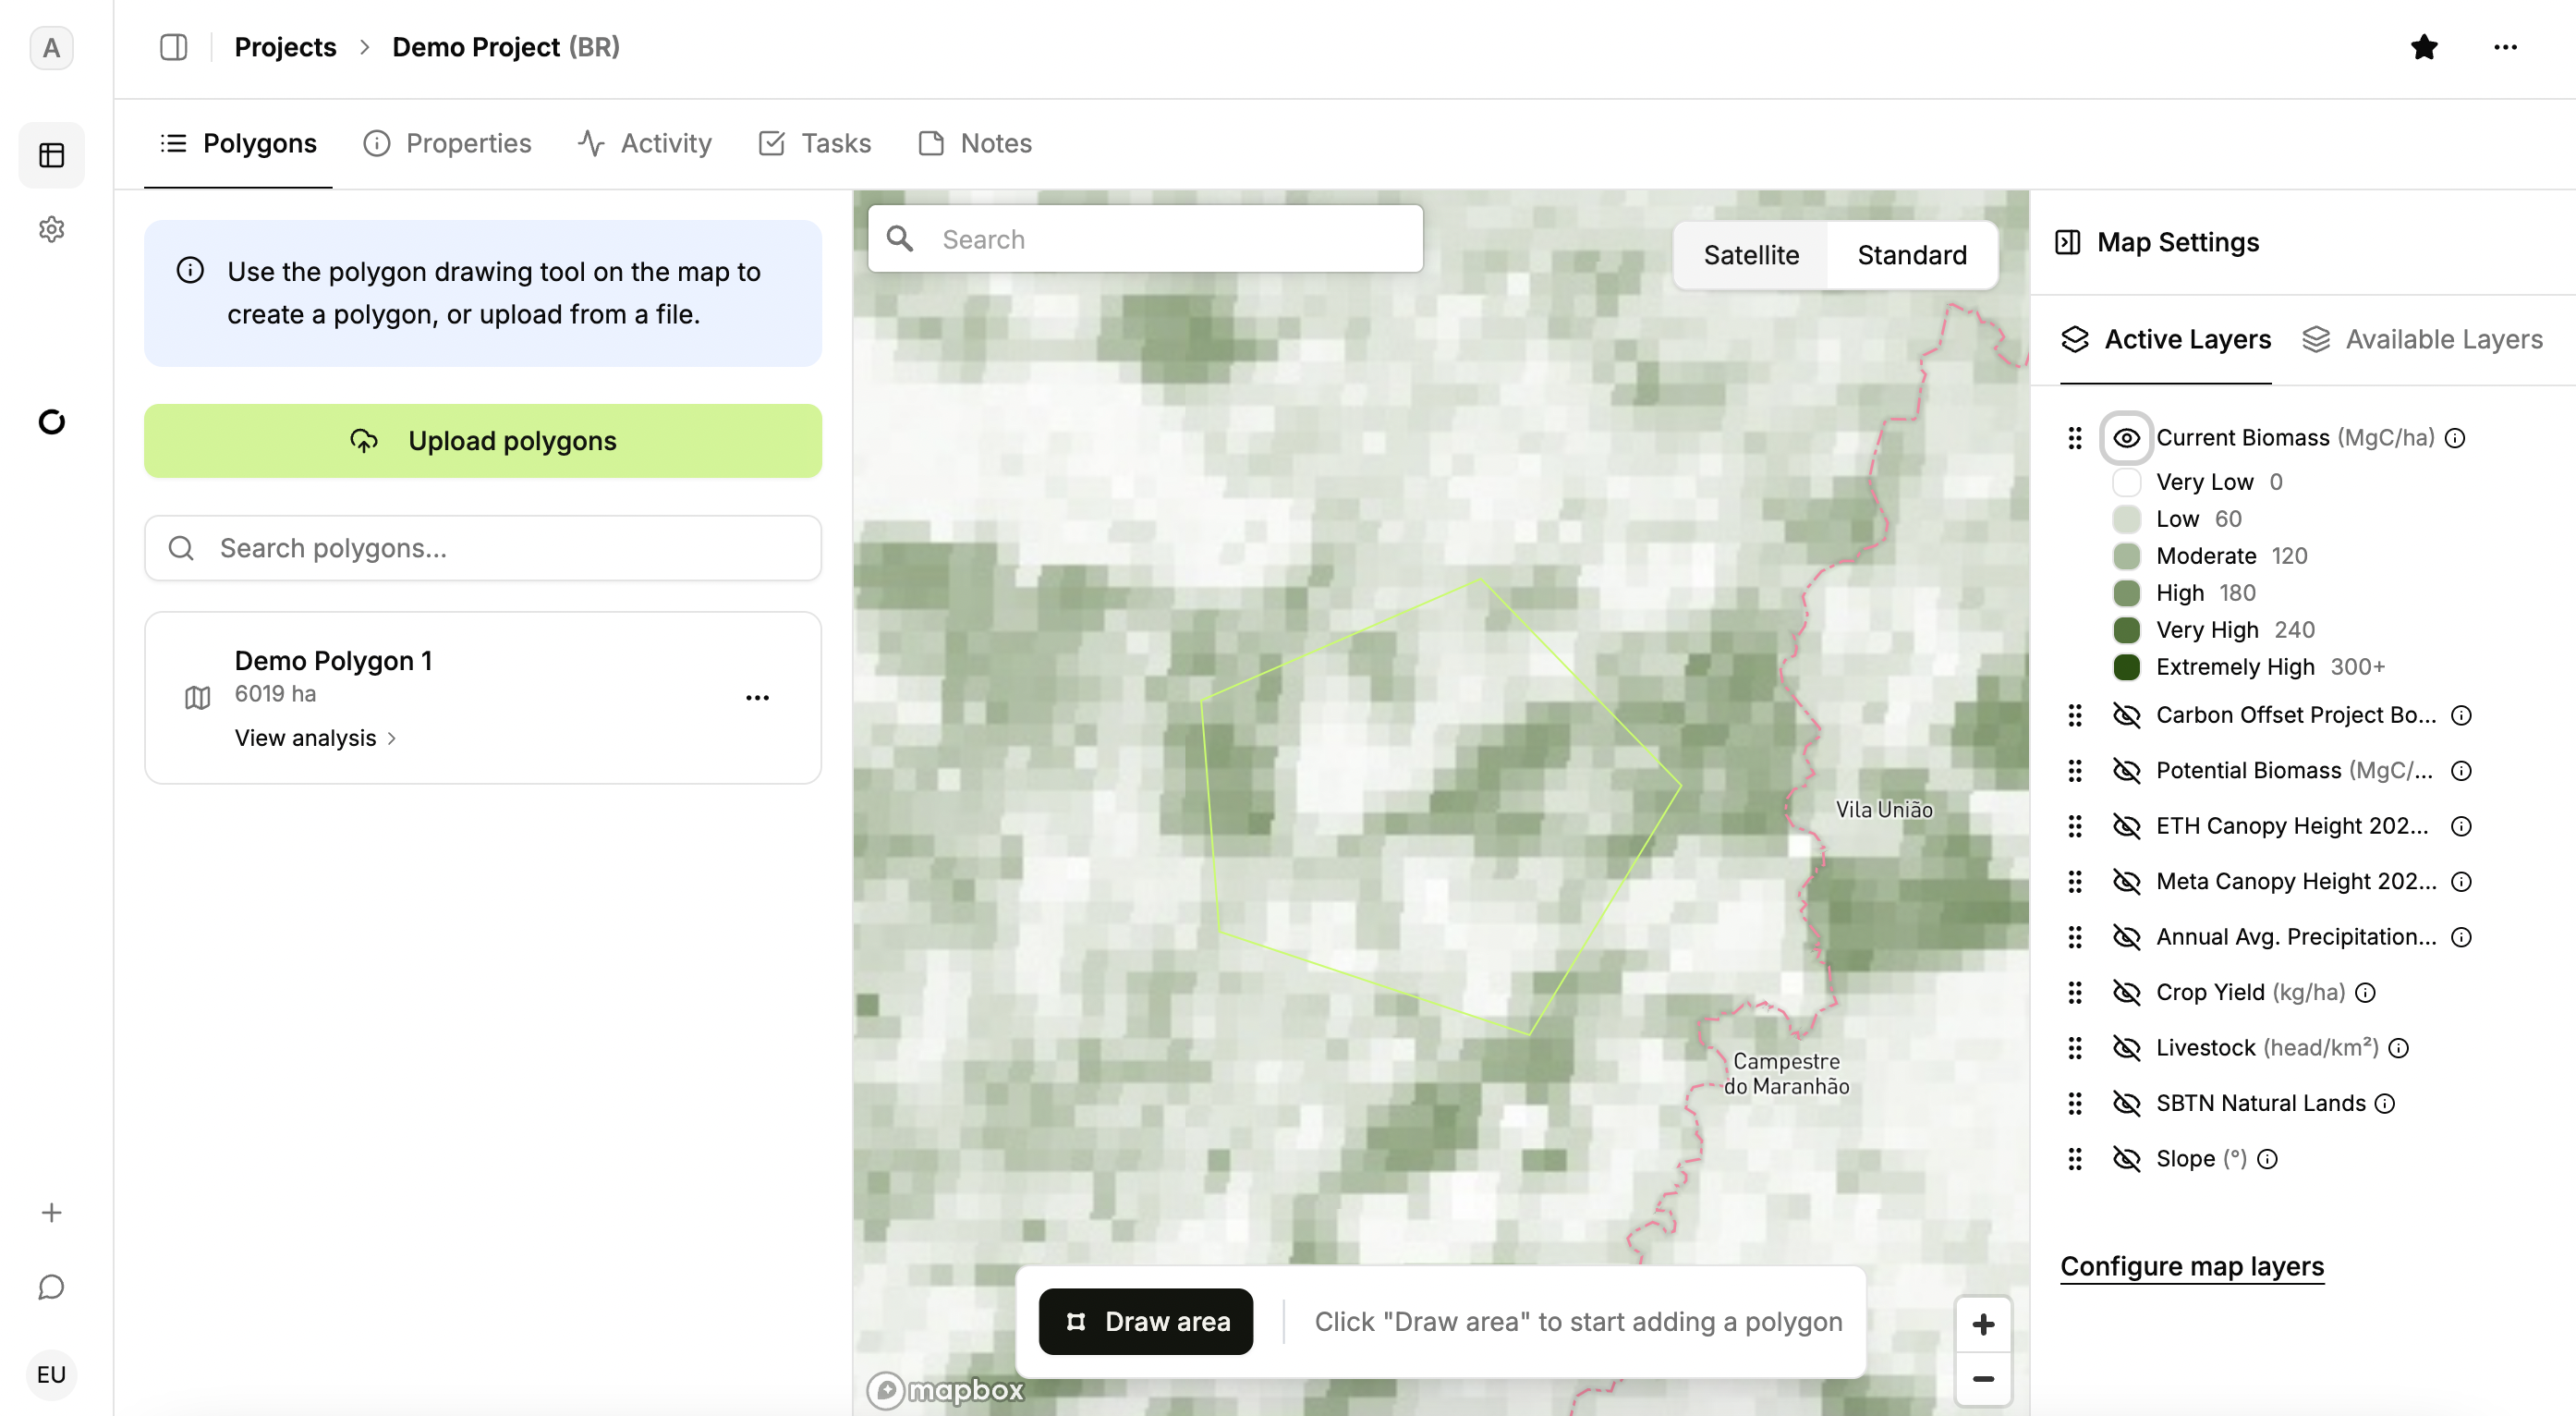
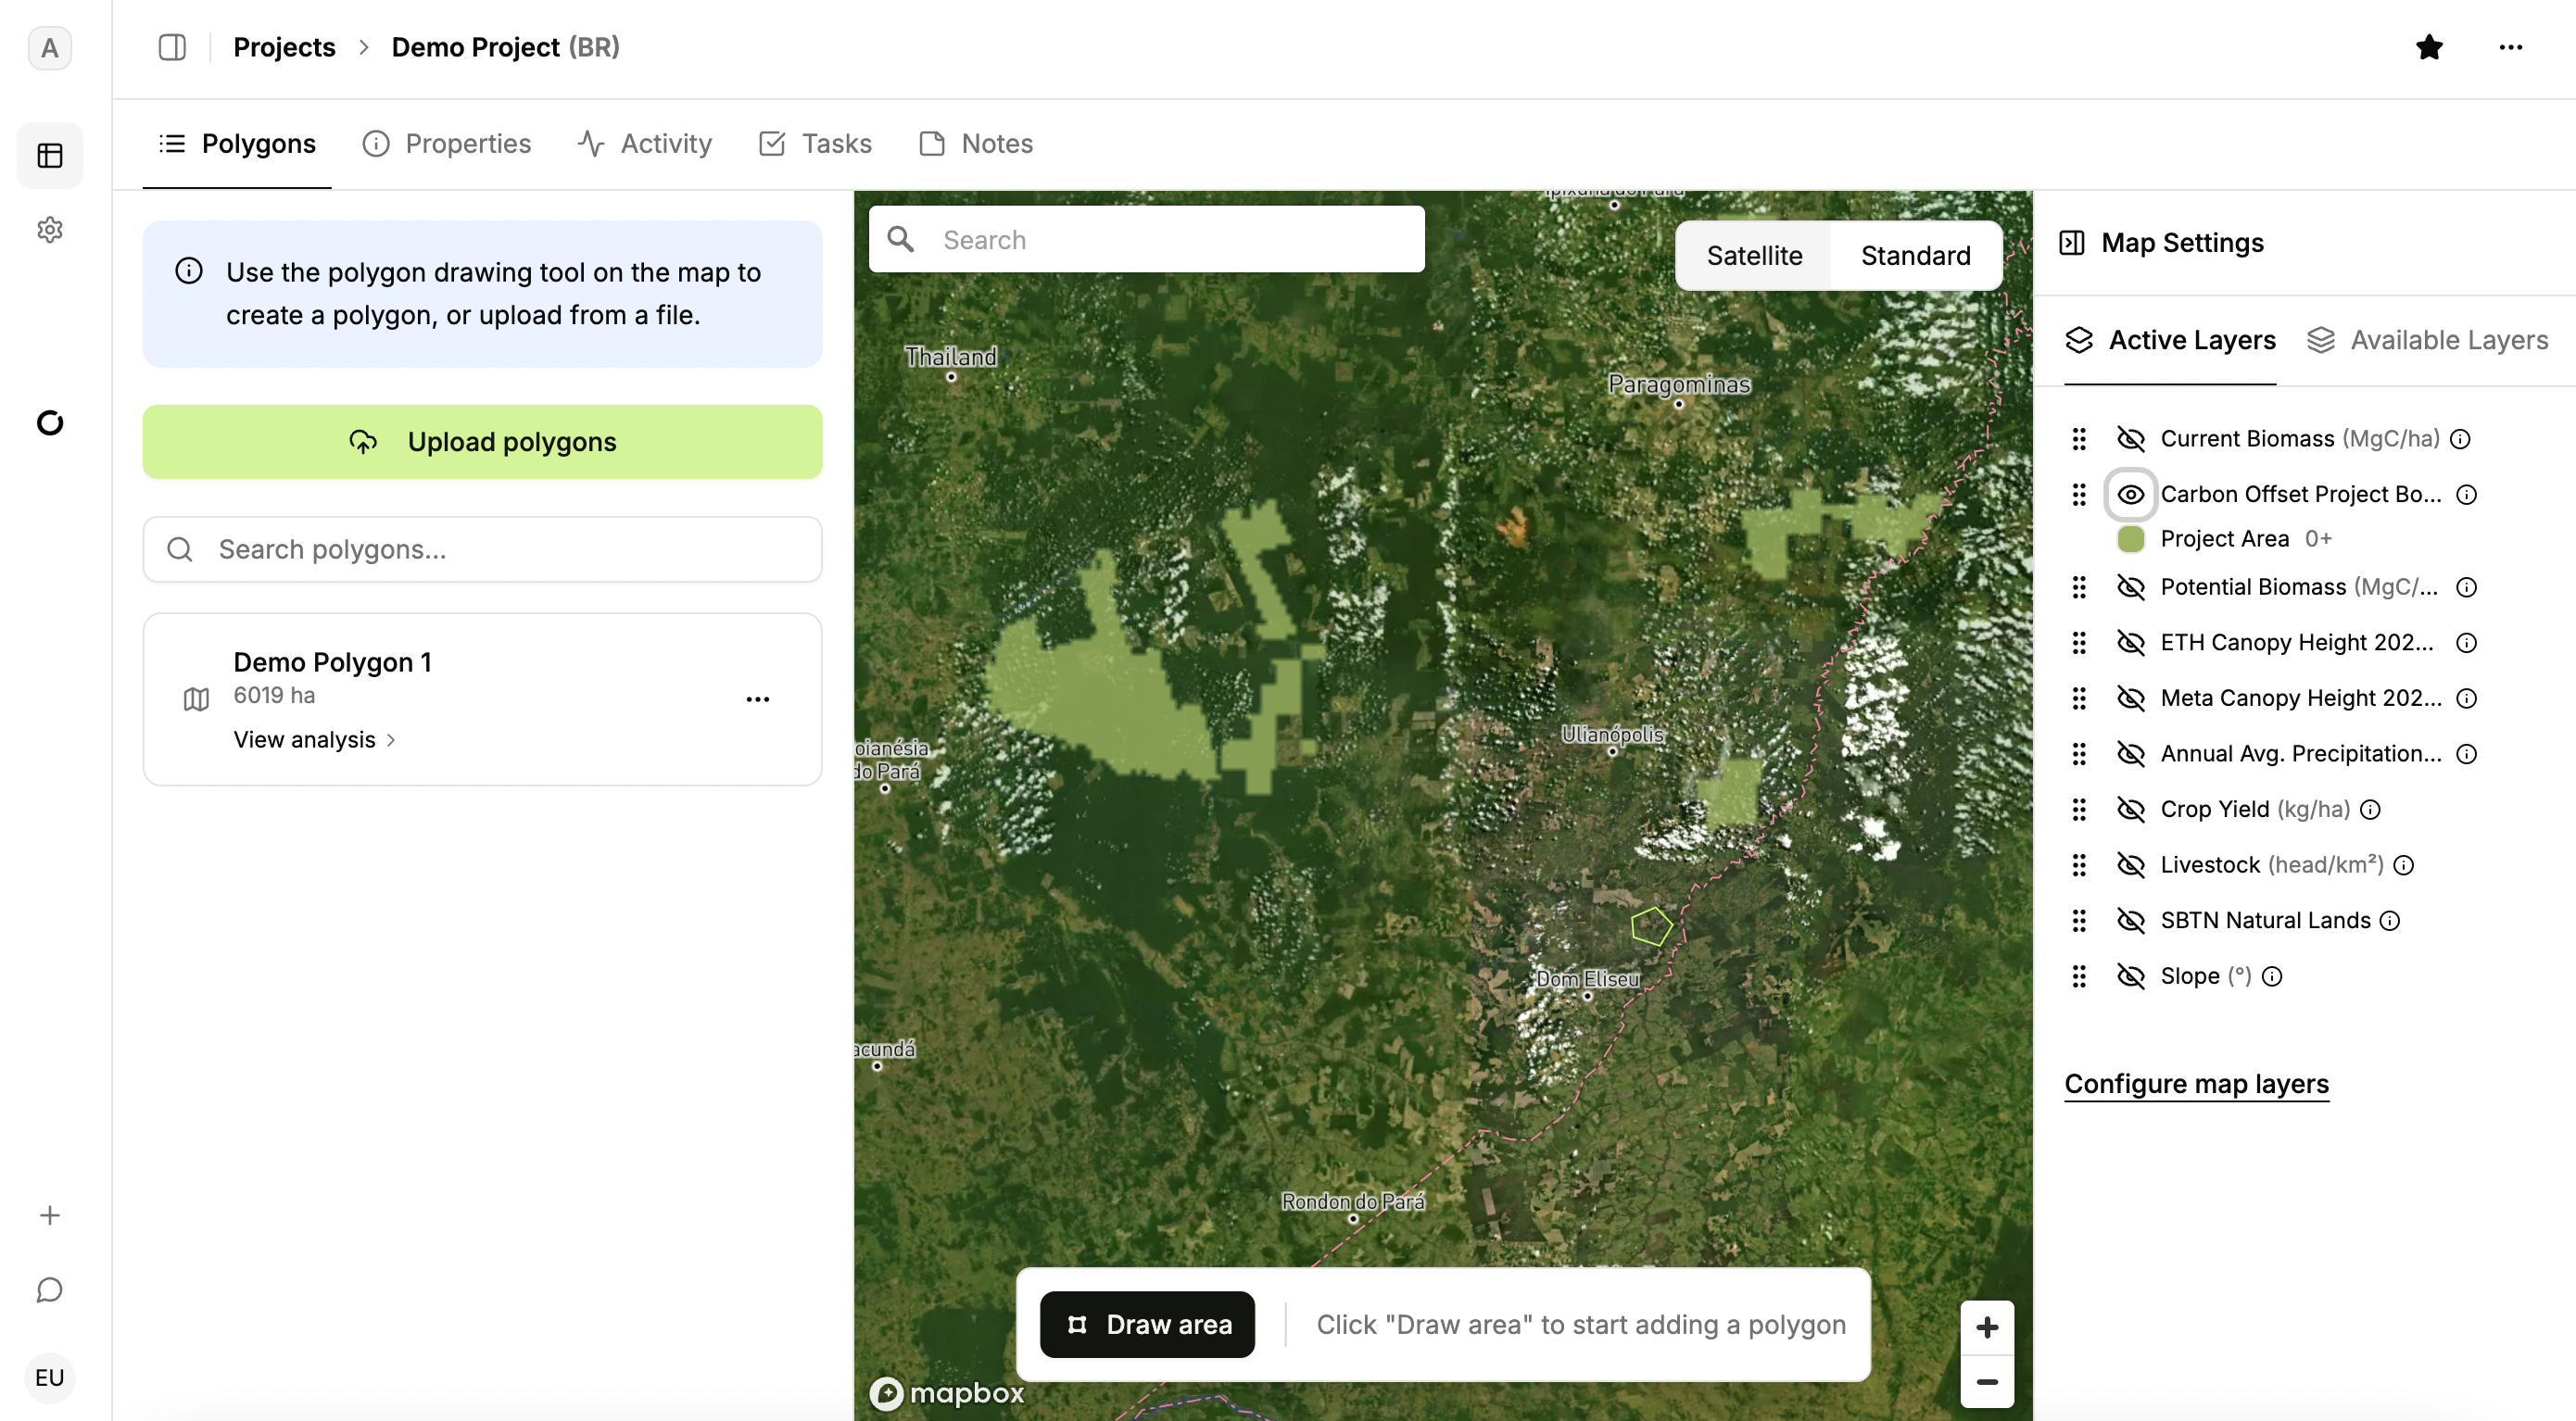
The map drawer features two tabs: Active Layers and Available Layers. Active Layers show datasets already loaded into memory; toggle their visibility using the eye icon.
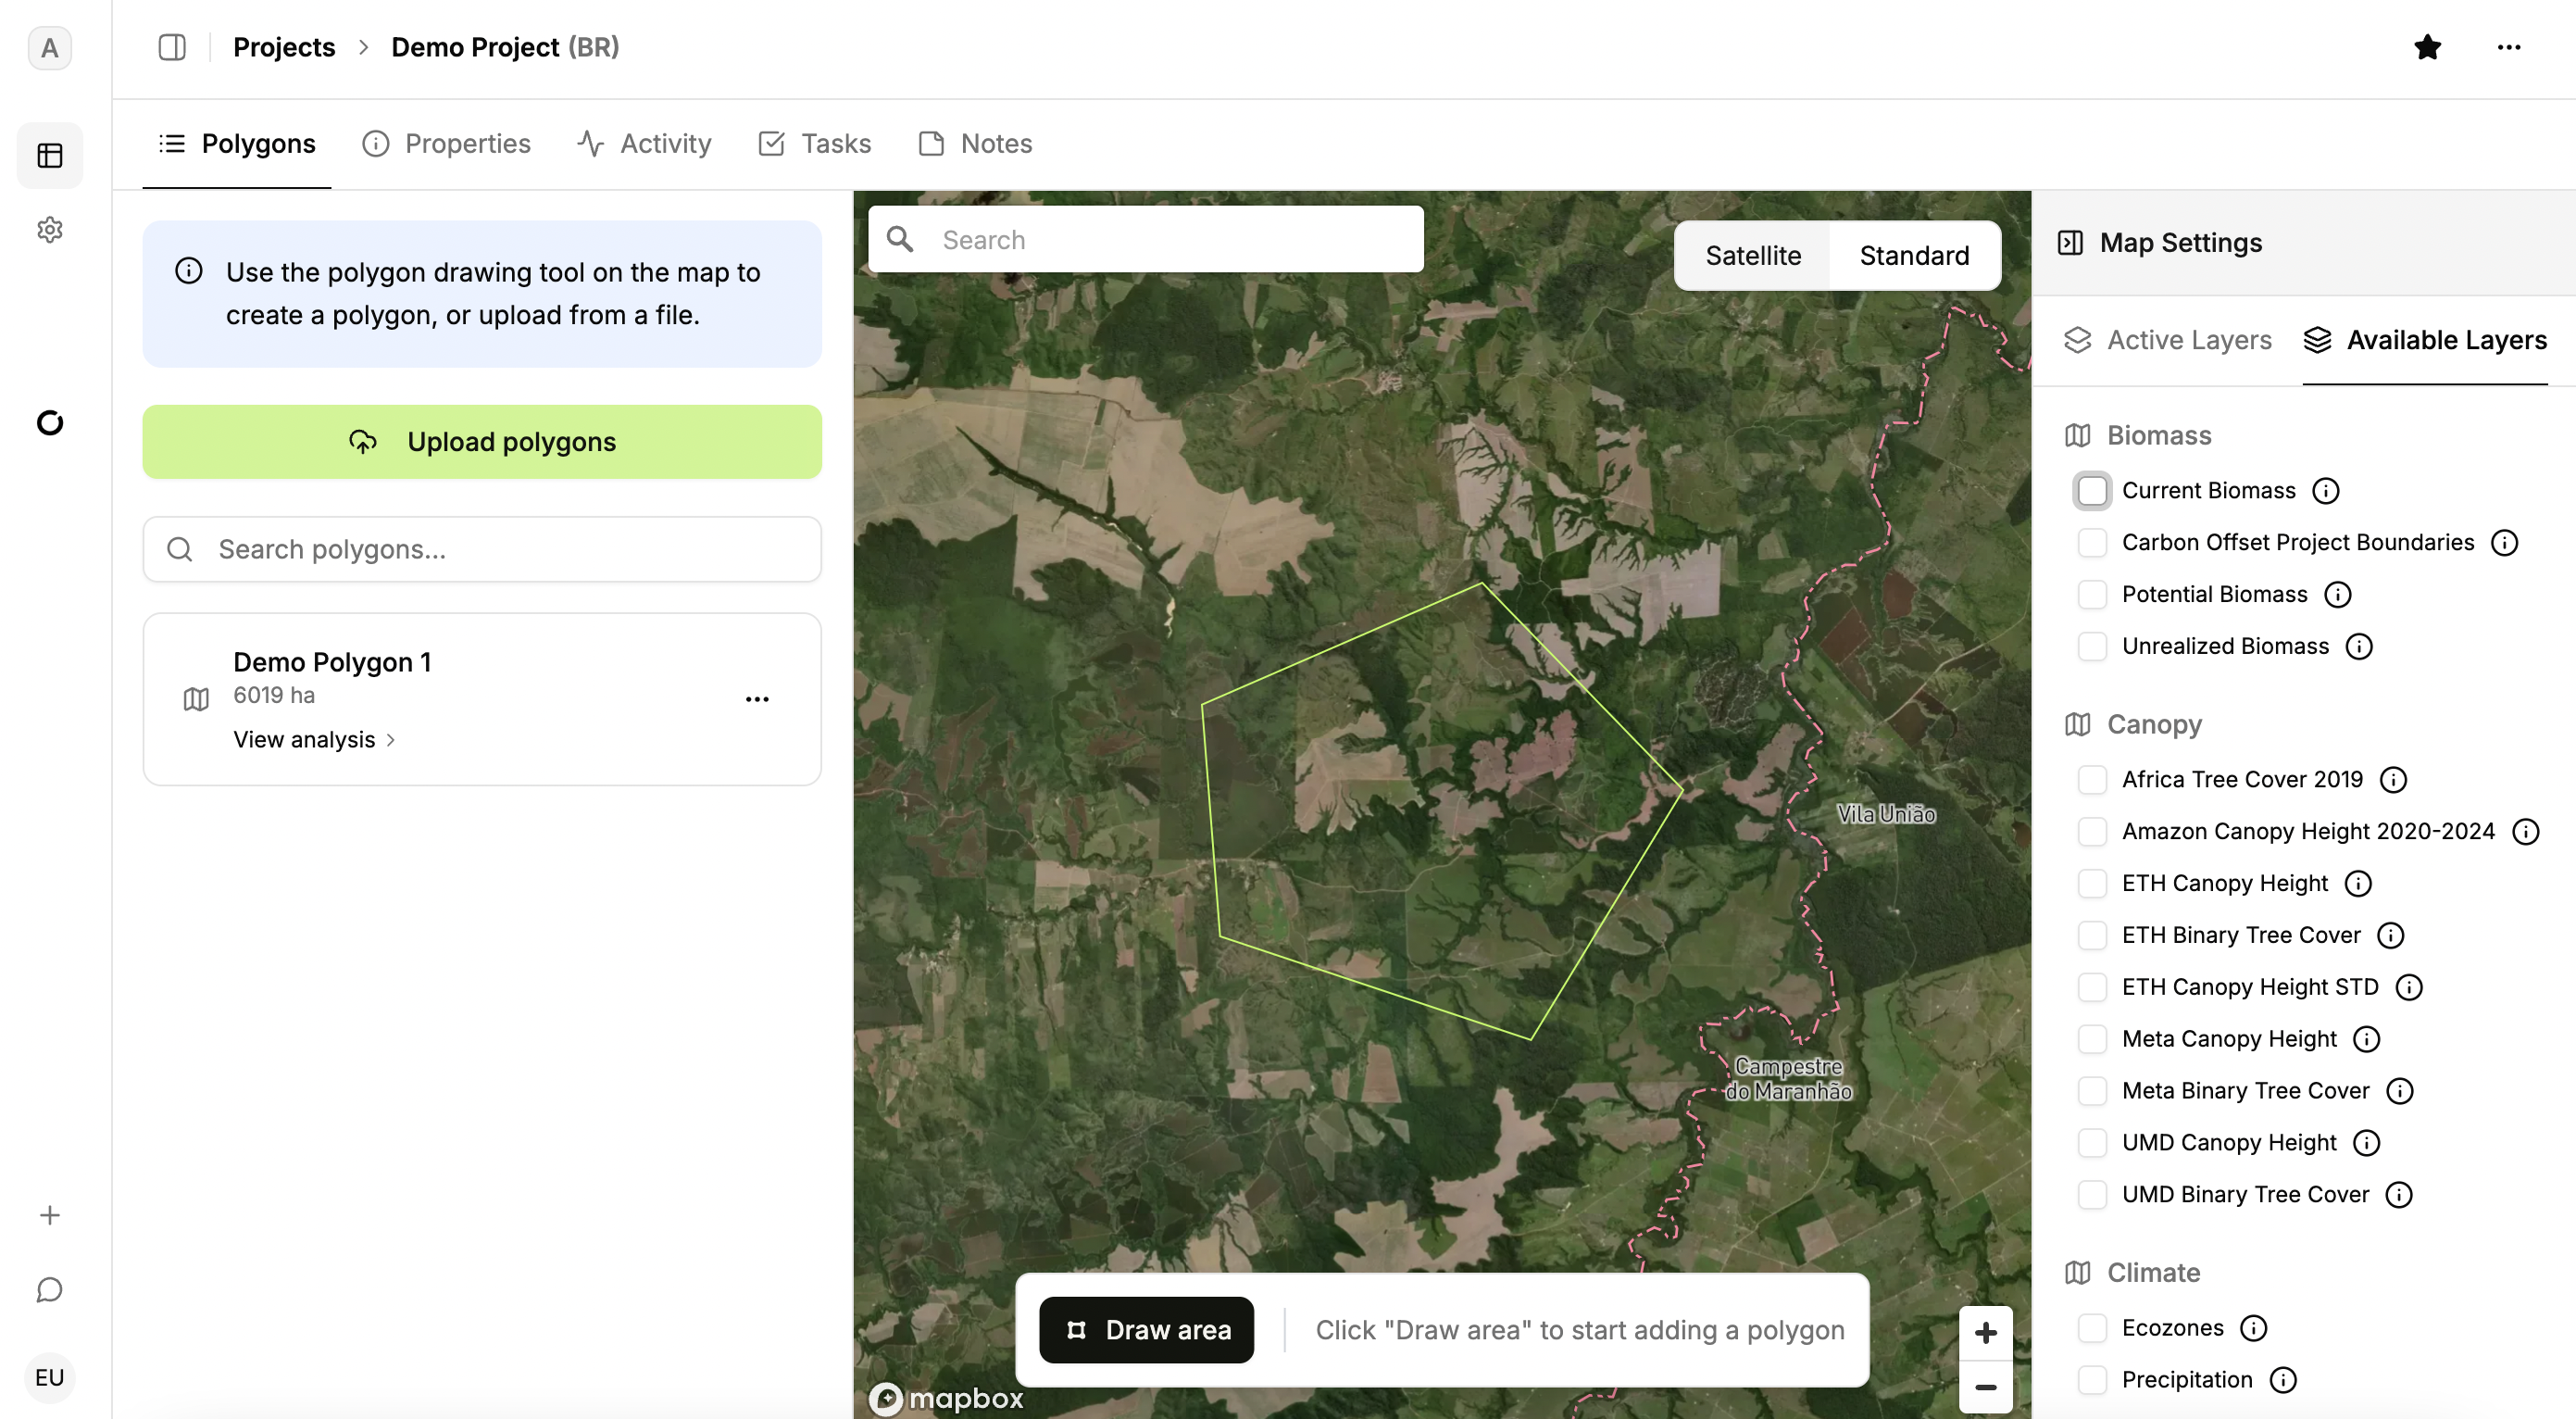
To load more map layers, click the Available Layers tab and select the datasets you need.
Then press “Save” to add these layers; they'll now appear in the Active Layers tab.
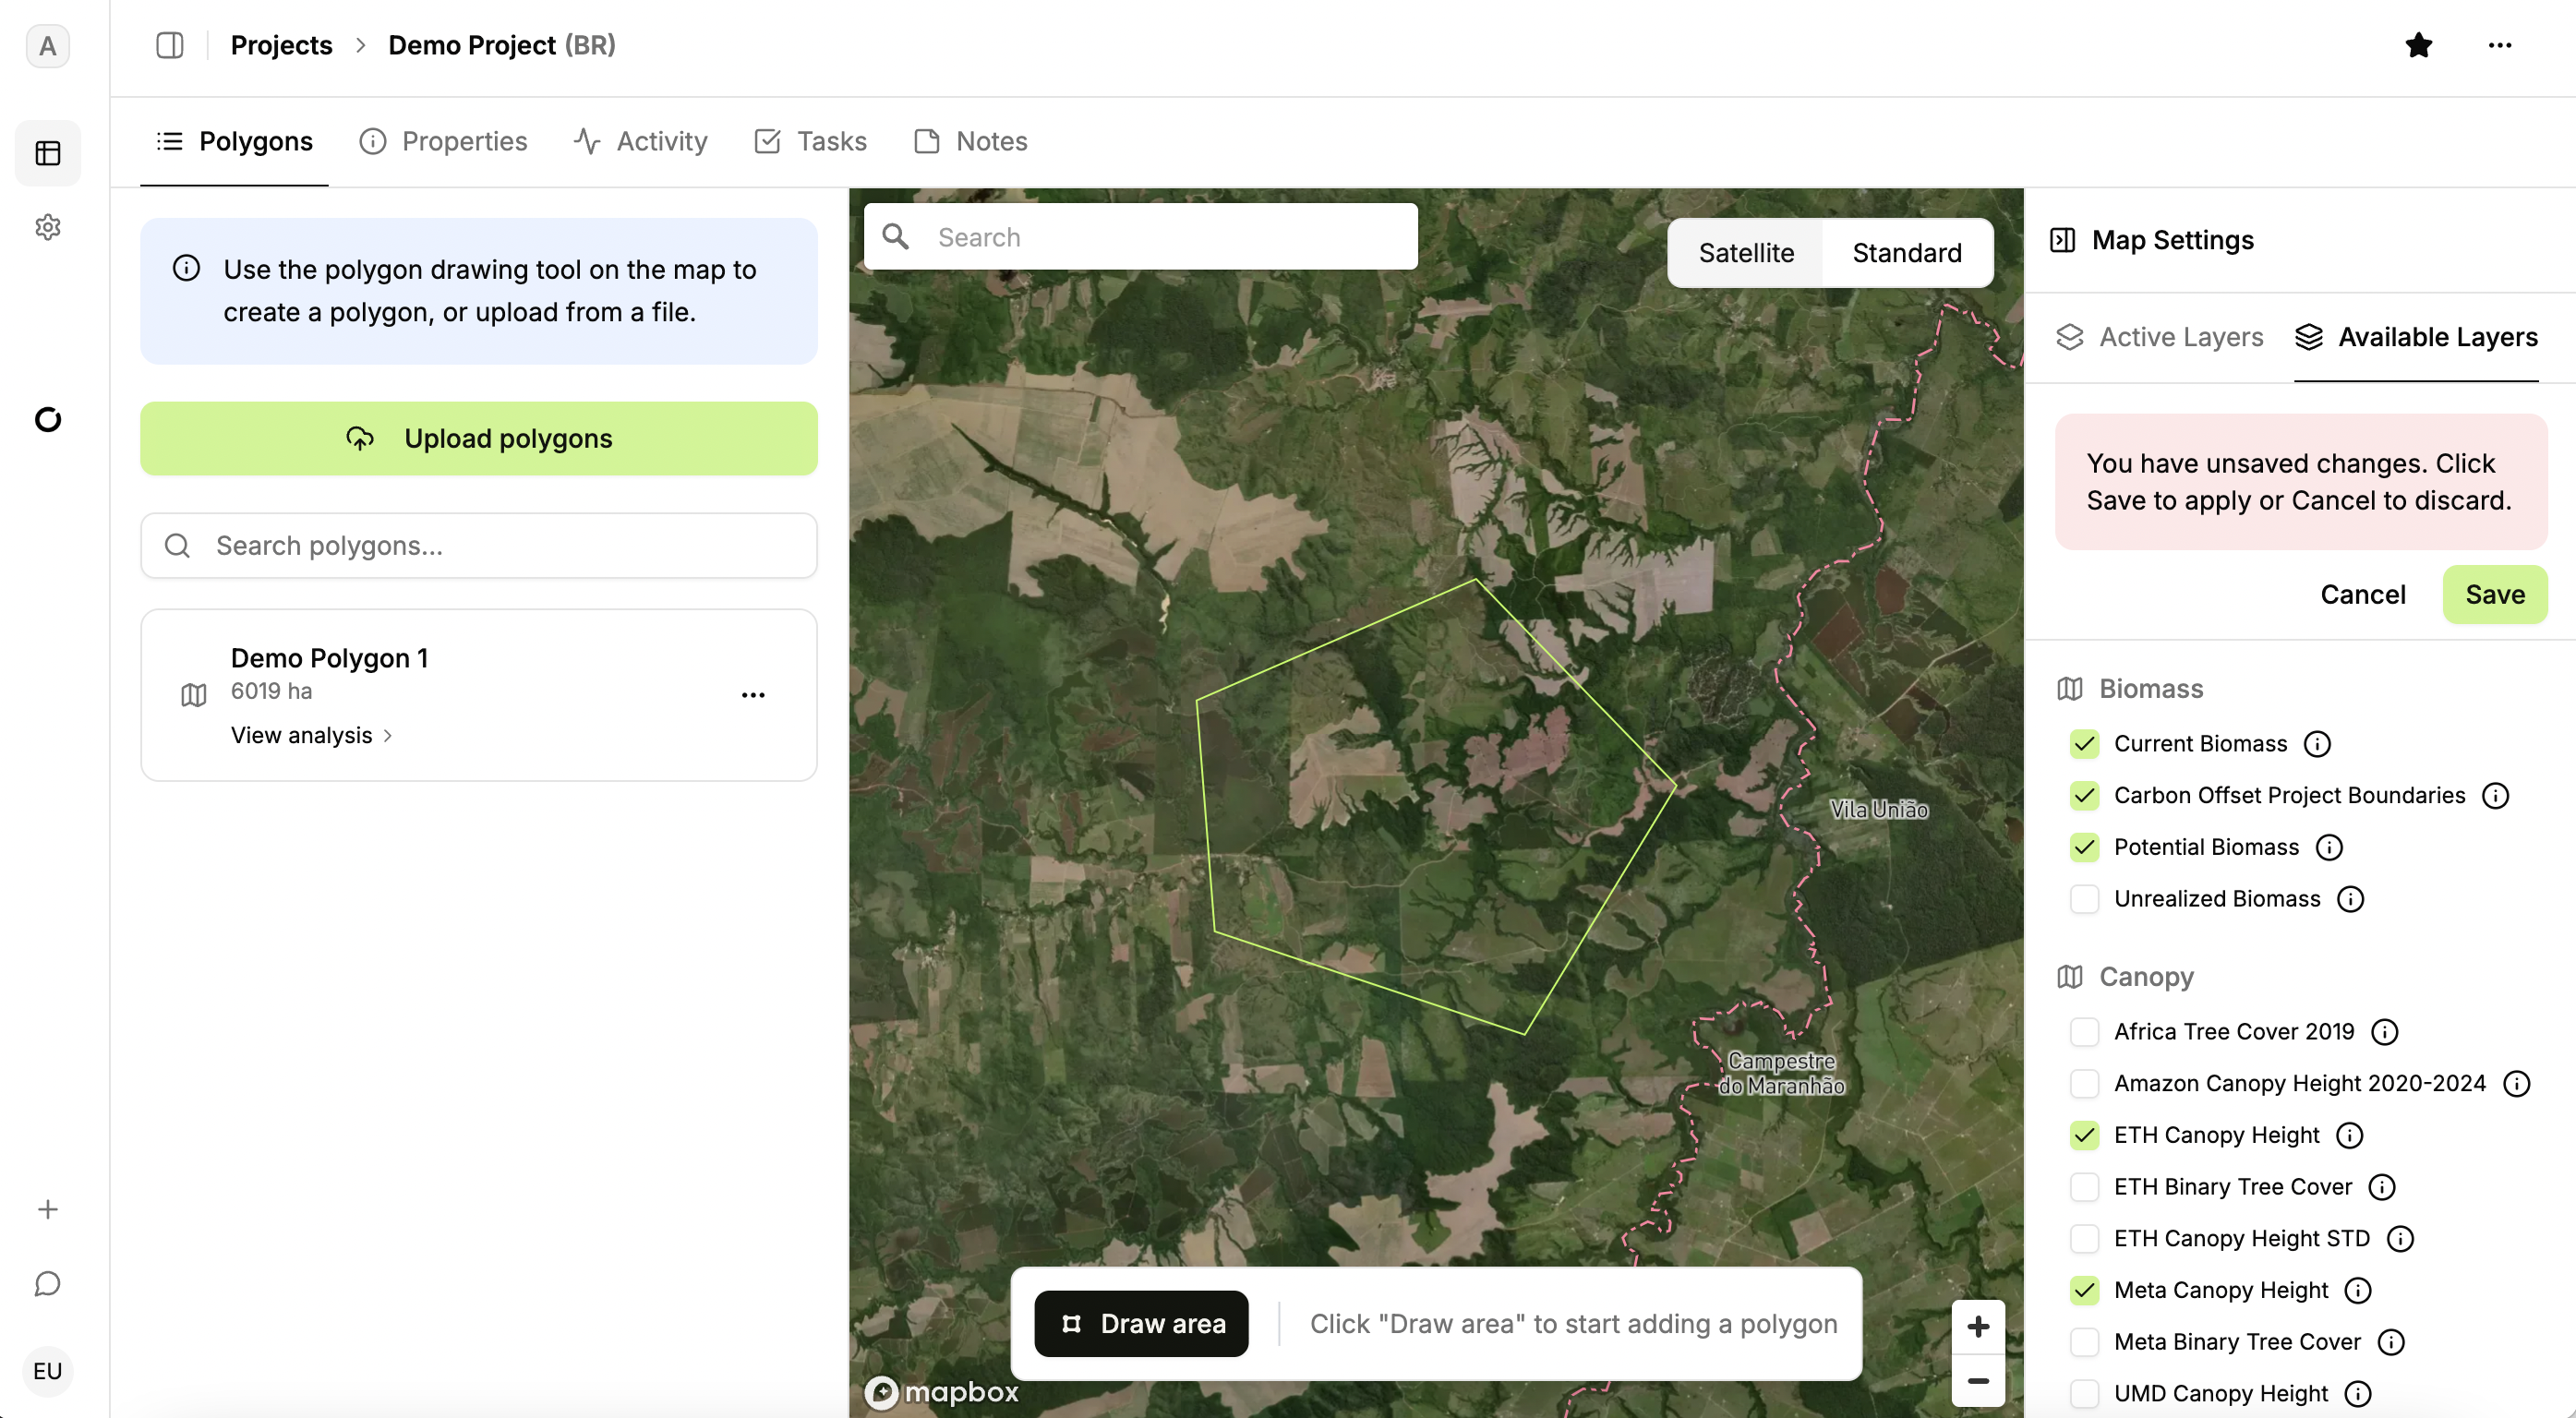
Switch back to the Active Layers tab to view and manage the newly added datasets.
Polygon
Analysis is done at the polygon level. To work within a specific polygon, select its name from list in the left panel.
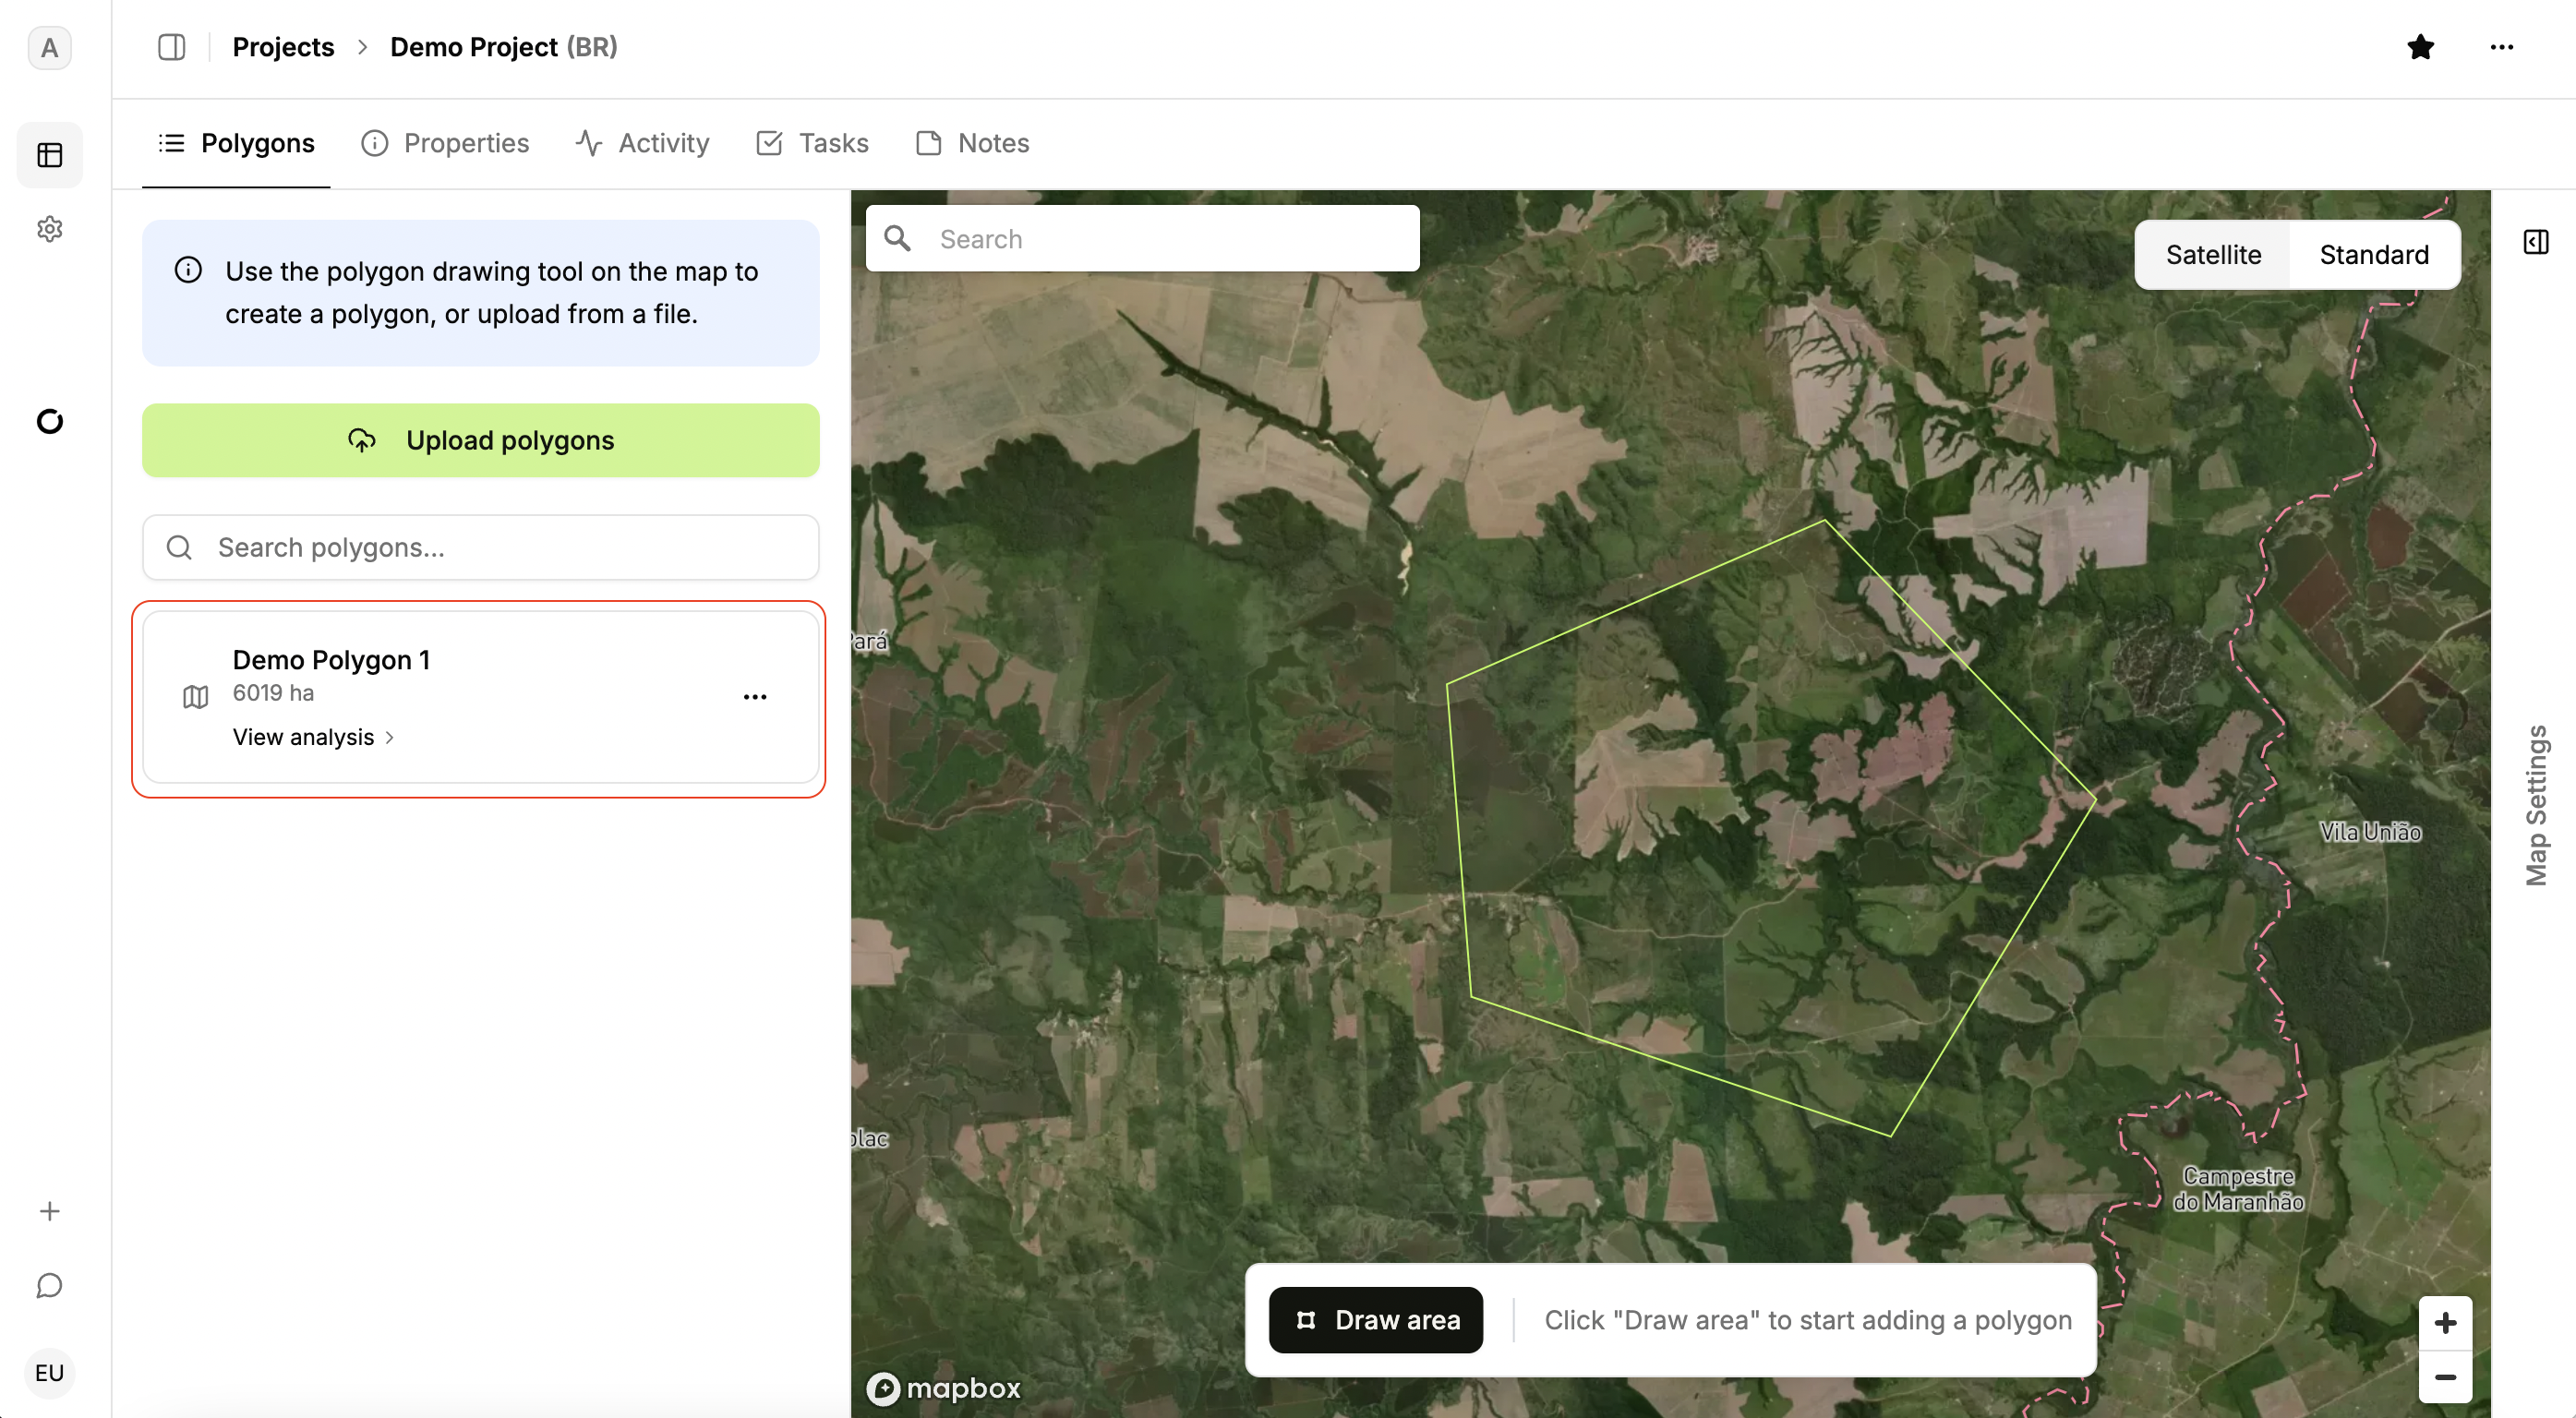
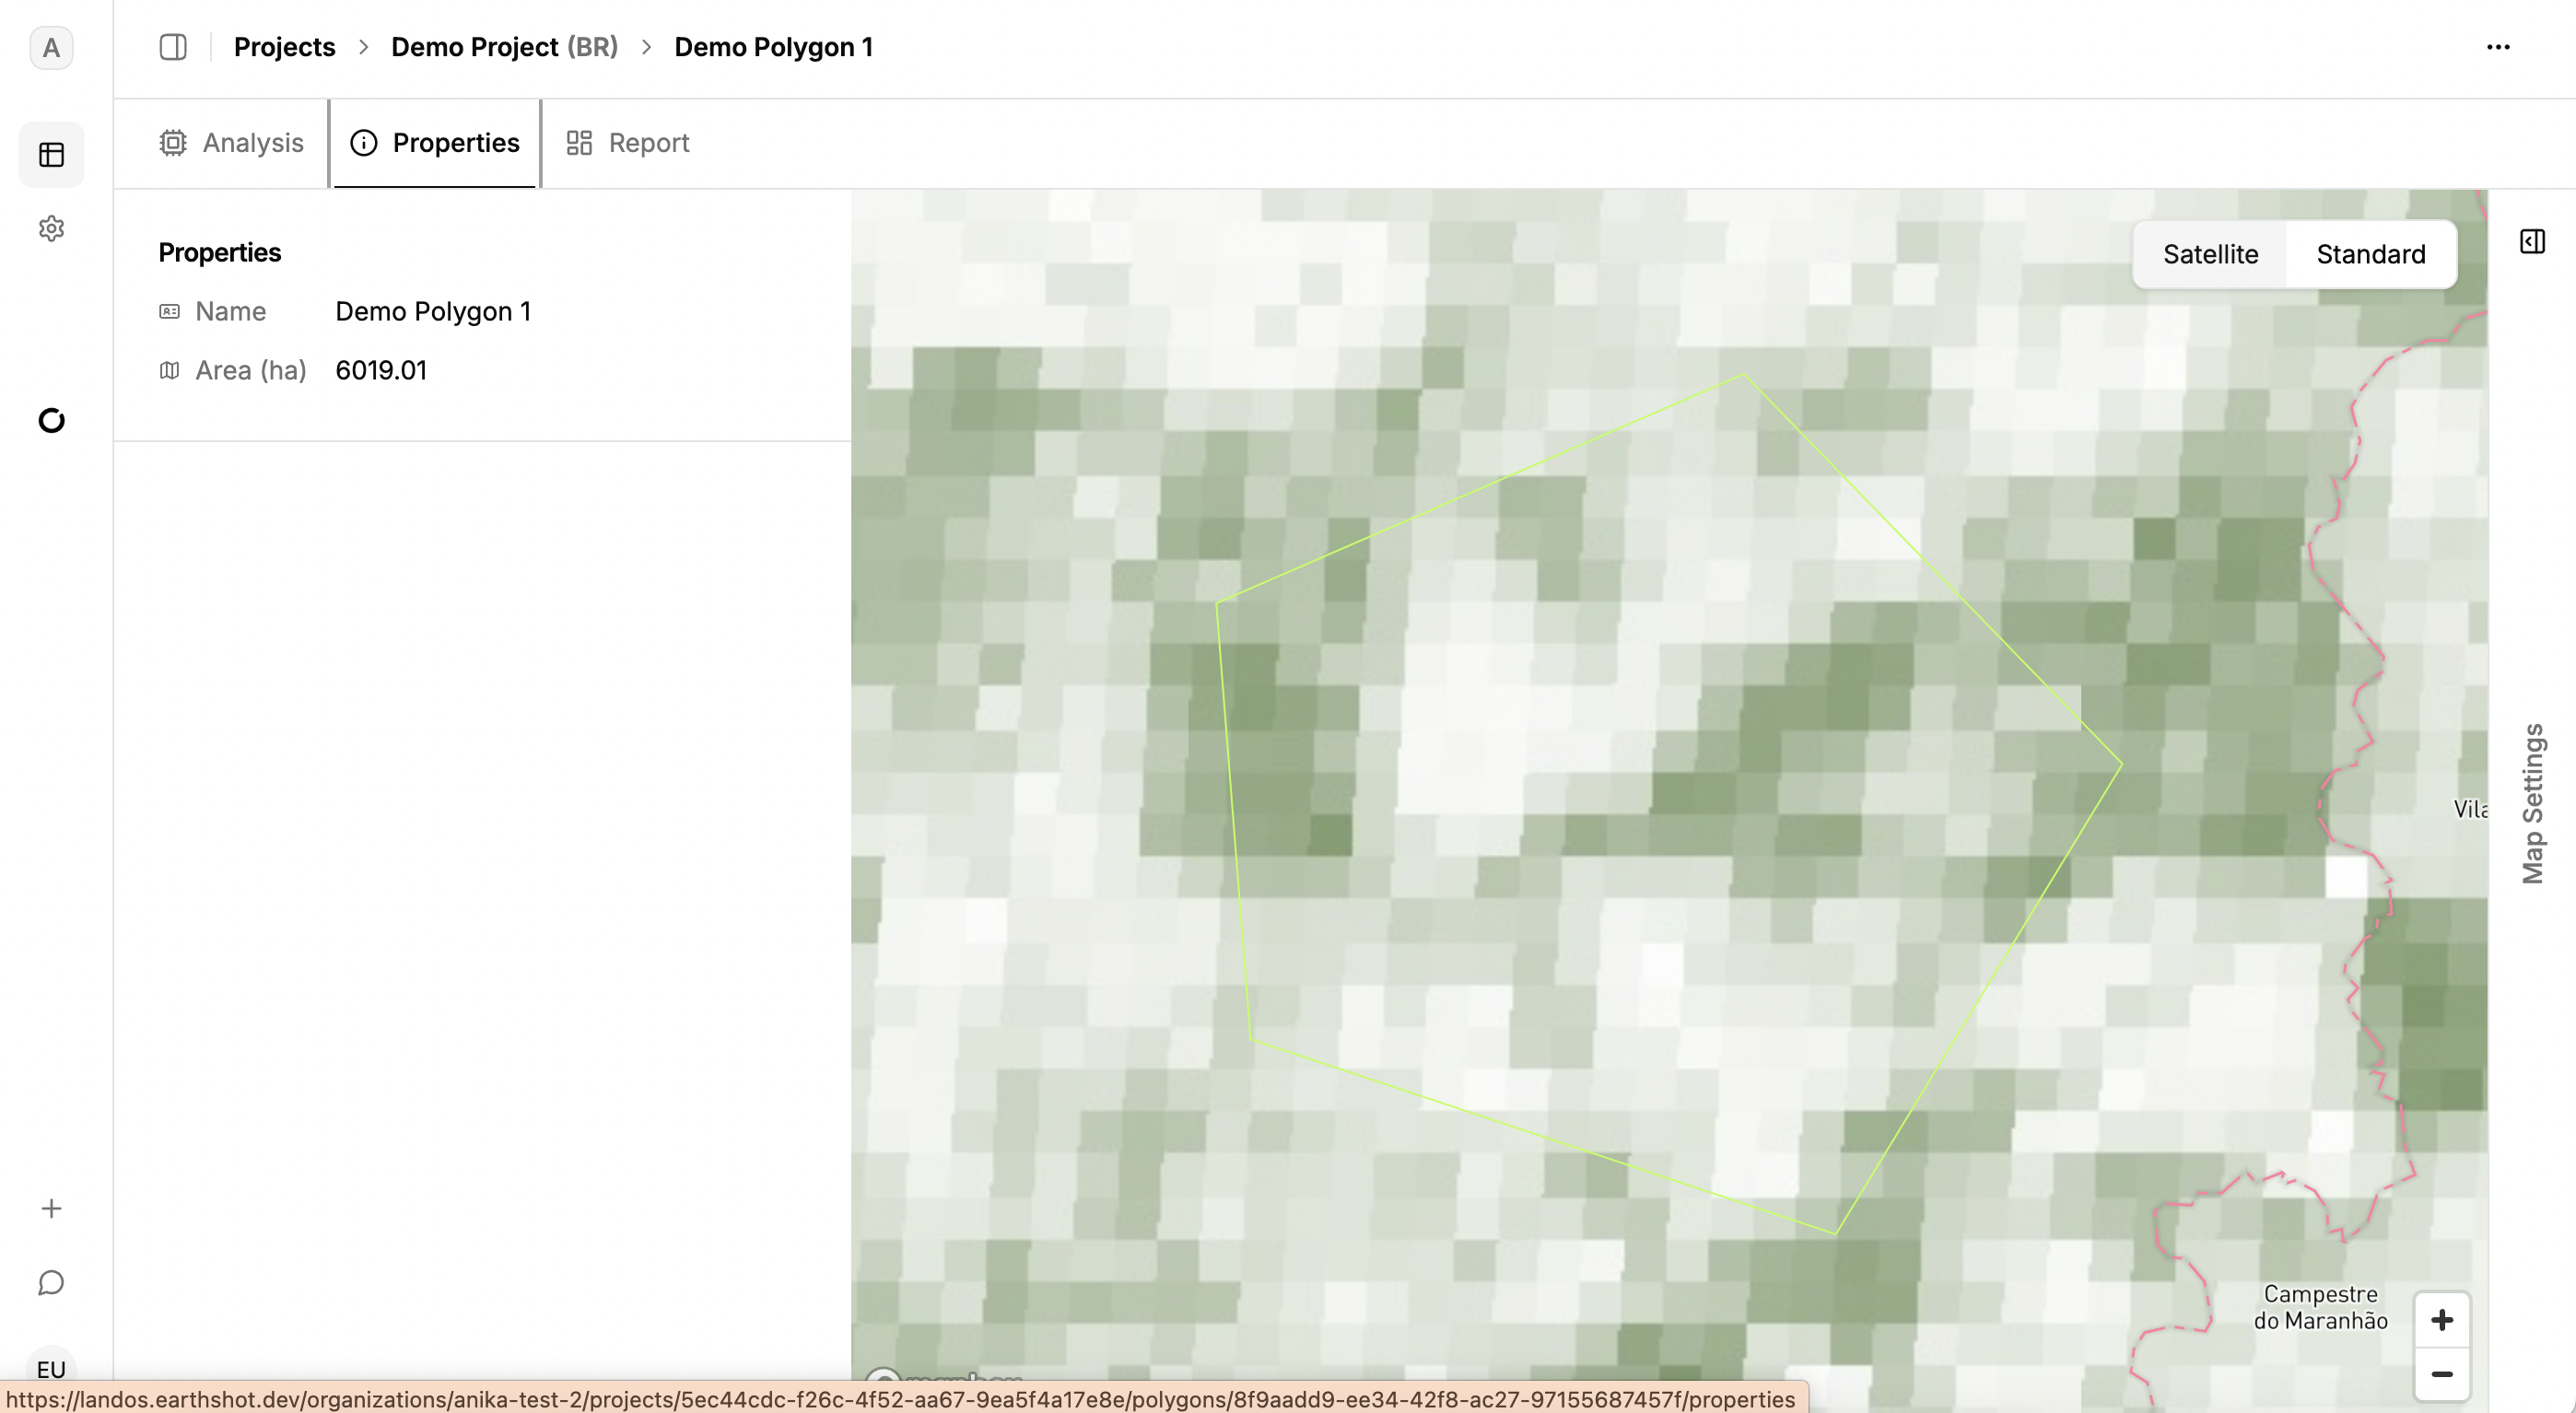
In the Polygon view, tabs for Analysis, Properties, and Report are available. The Properties tab displays details such as name and area.
Analysis
Start quantitative analyses in the Analysis tab. Click “New analysis” to run computations. This is the core functionality of LandOS and provides pre-feasibility results for the polygon.
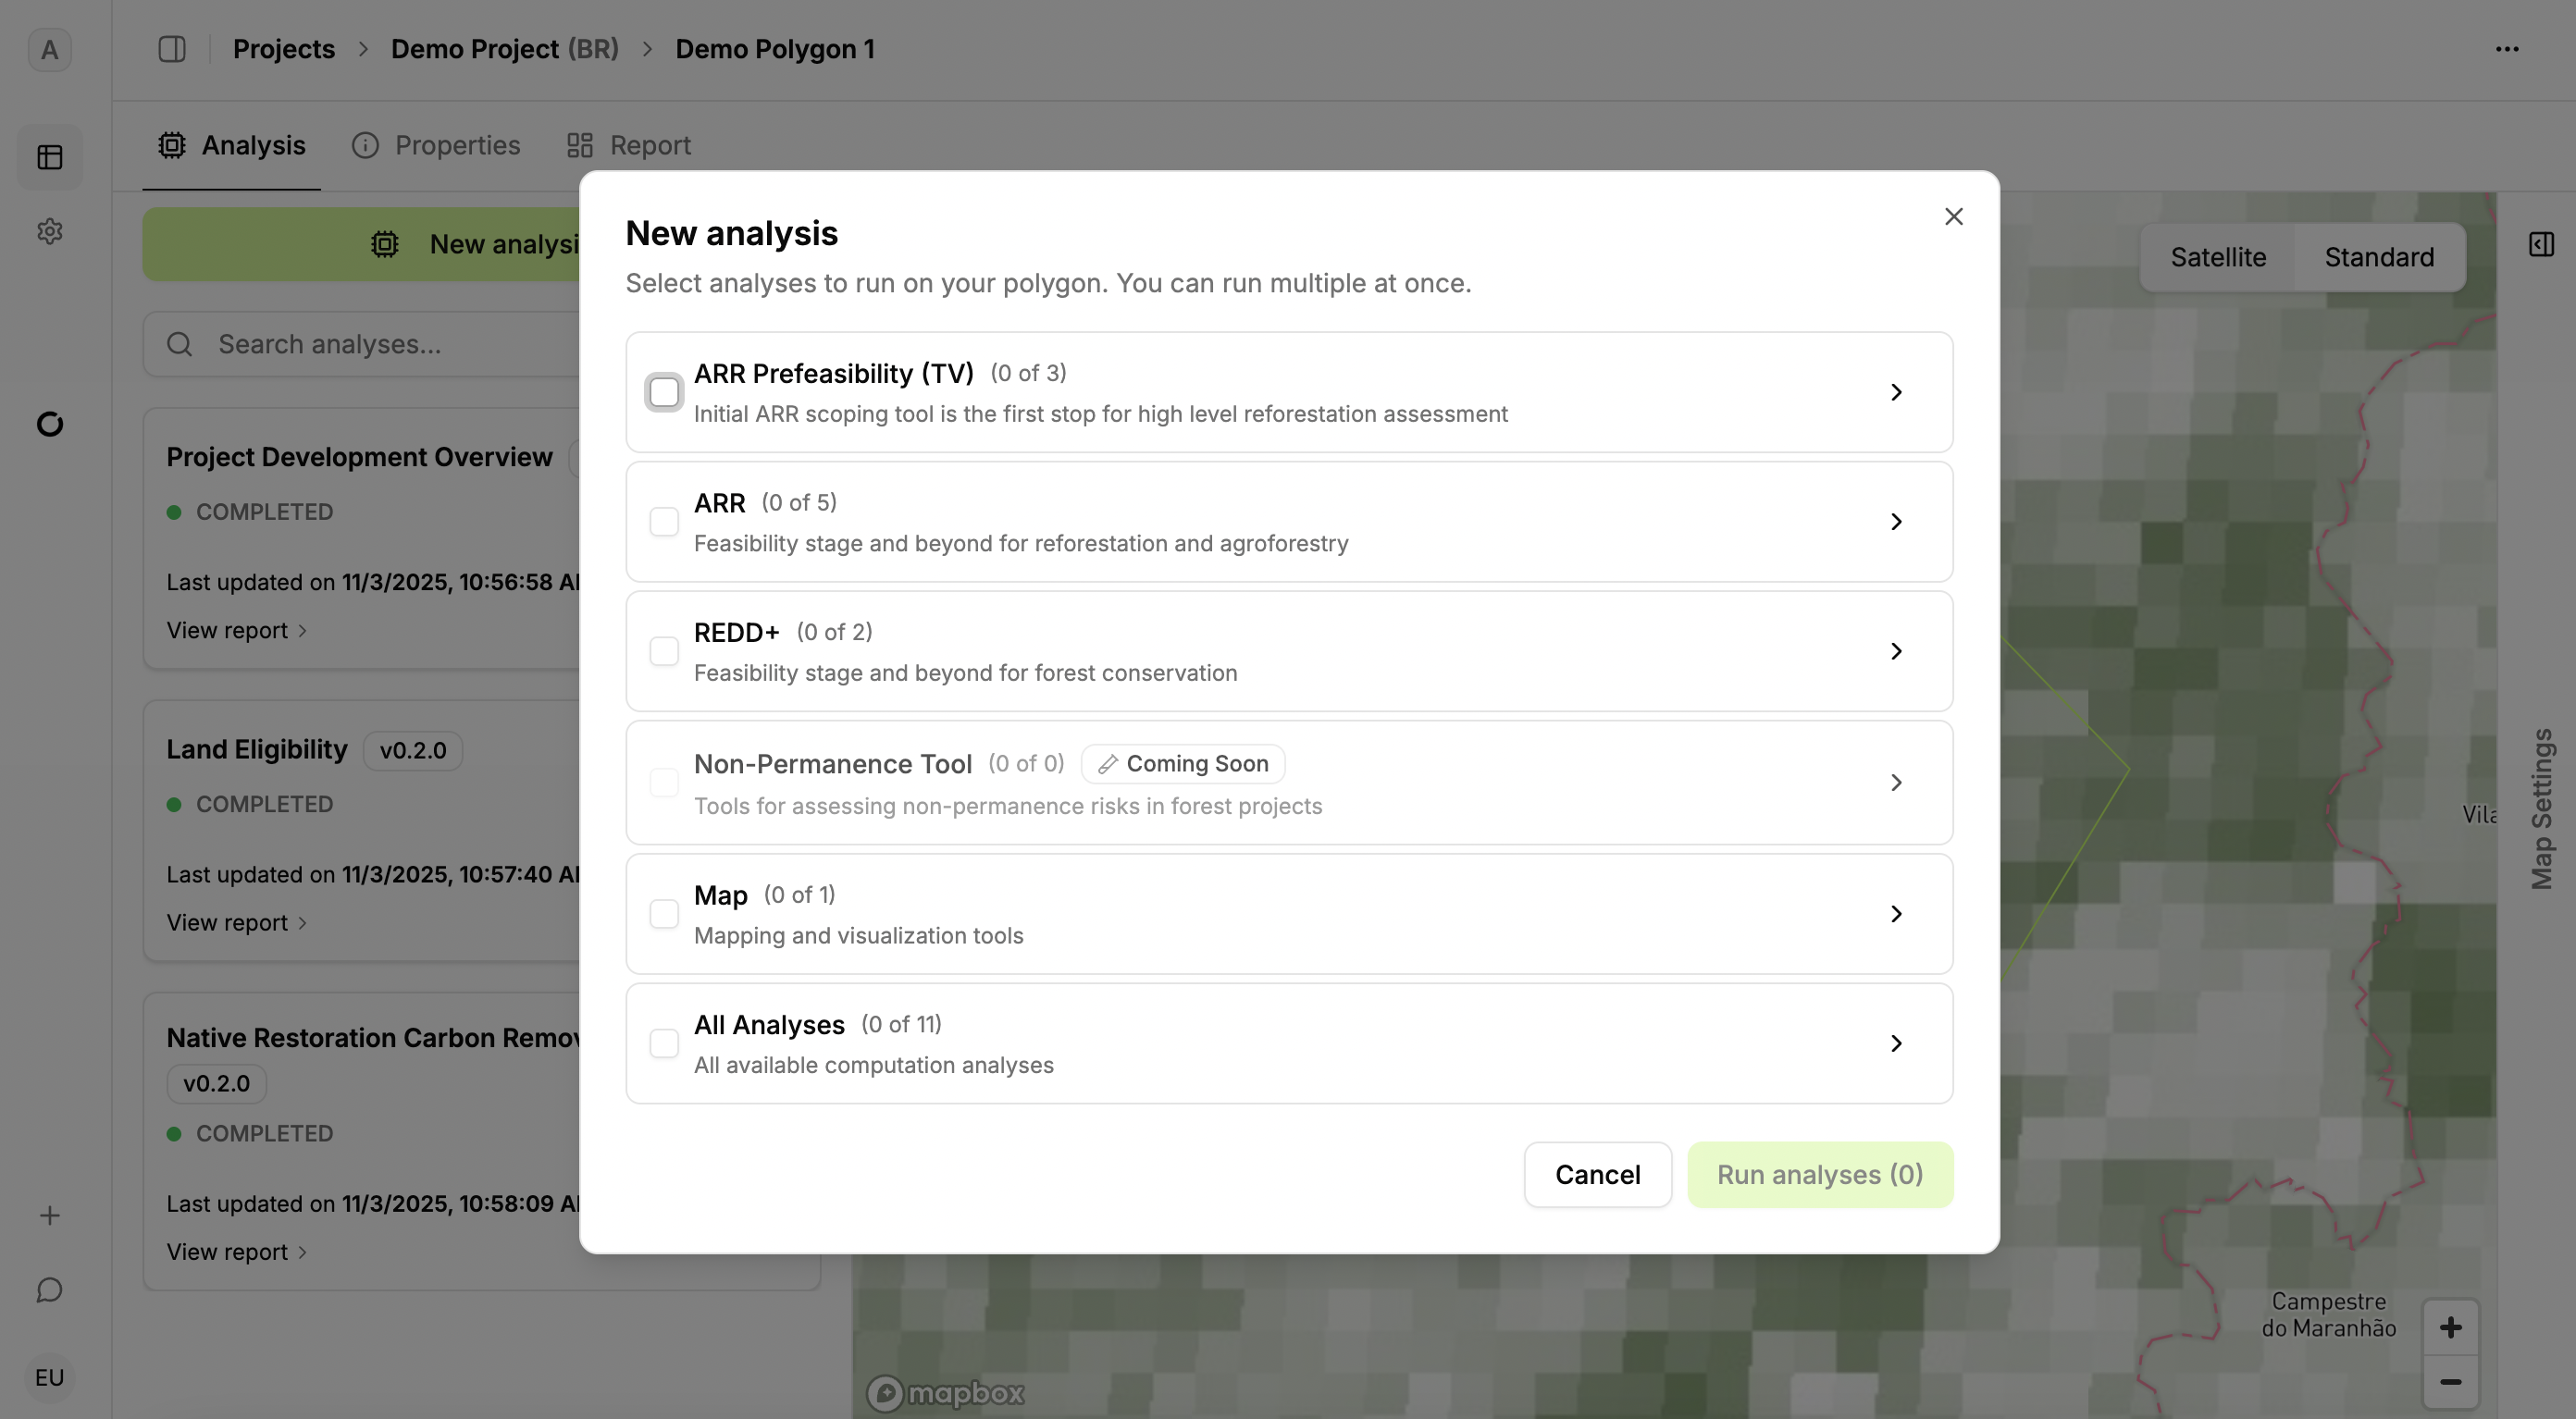
Analyses are grouped by project type. The ARR Prefeasibility (TV) tool assess reforestation projects aiming for closed-canopy forest. An agroforestry model is coming soon.
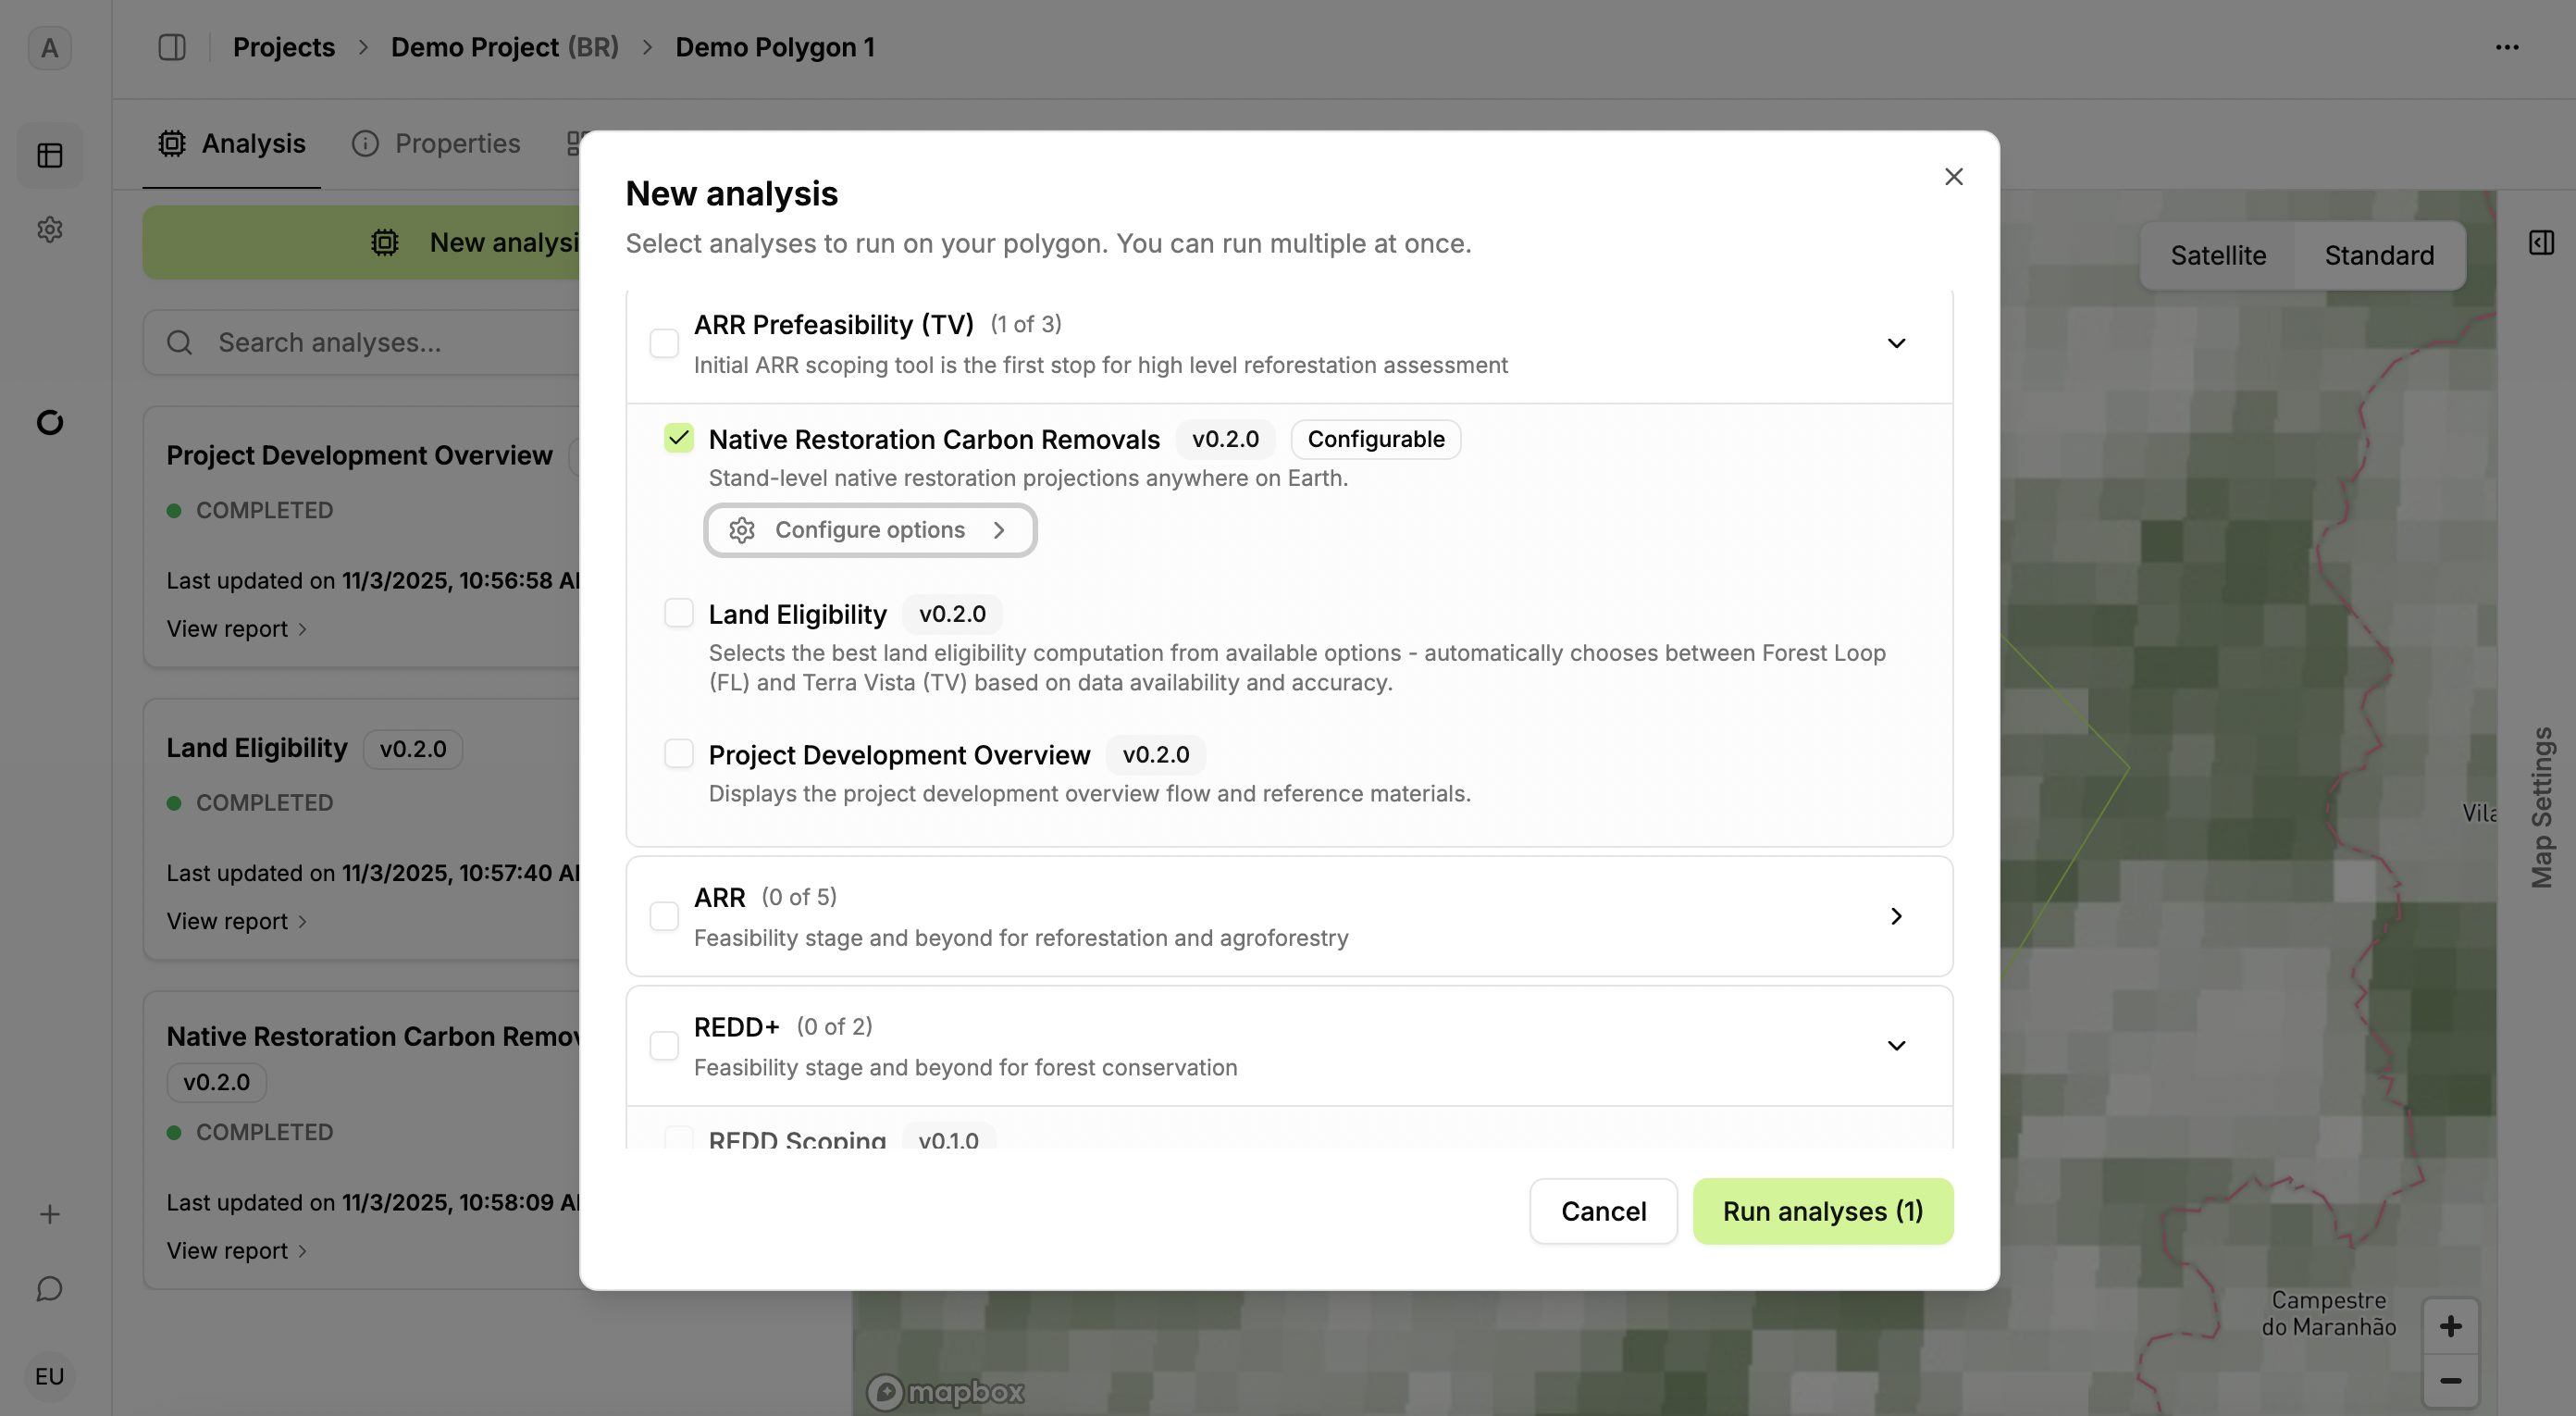
The ARR Prefeasibility (TV) analysis has three components: Native Restoration Carbon Removals, Land Eligibility, and Project Development Overview. The Project Development Overview displays the project development flow and reference materials. The Native Restoration Carbon Removals runs our proprietary growth model developed based on empirical observations of reforestation growth (see documentation section) and provides discount scenarios based on the productivity on the landscape that could lead to leakage. The Land Eligibility computation evaluates carbon project eligibility to confirm that there has not been deforestation in the past 10 years and the project does not convert native ecosystems. The dataset used for this computation depends on the geography of the project (see documentation section).
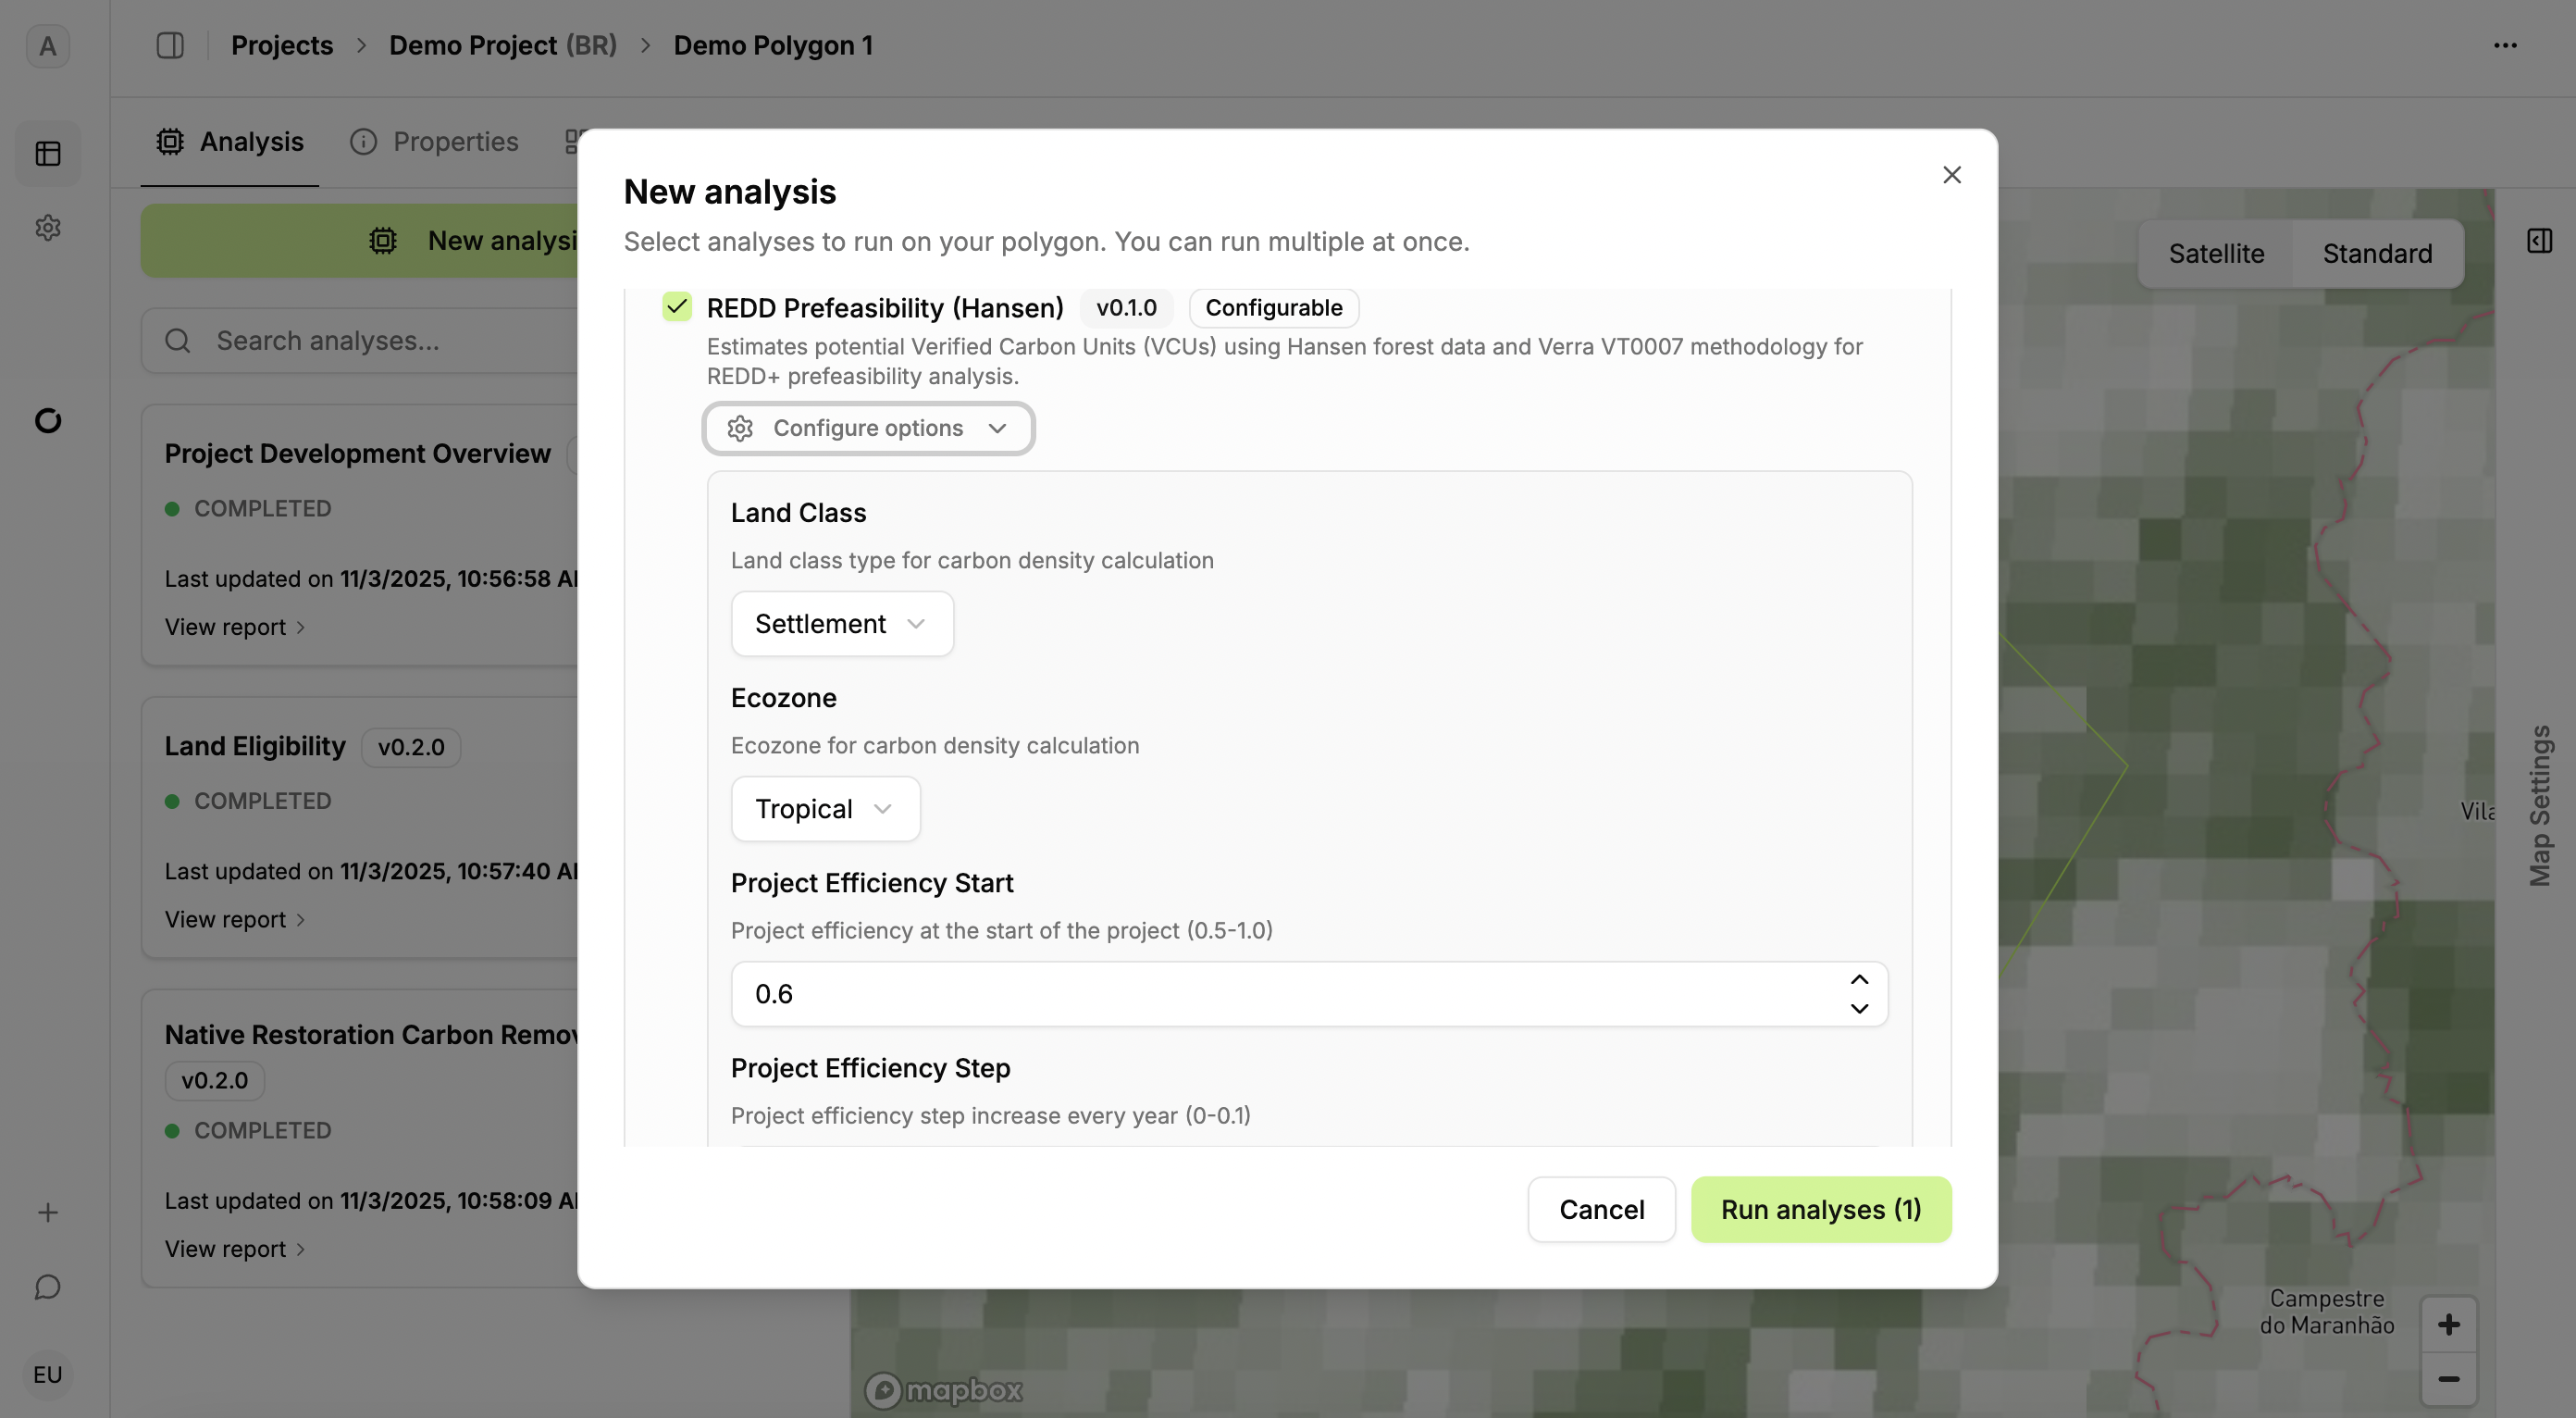
For REDD+ projects, LandOS evaluates projects using the VM0048 framework, Verra activity data if available, or using Earthshot’s own deforestation risk model developed using Hansen data.
Further tools are in development for functionality such as non-permanence risk evaluation, ARR performance benchmarking, agroforestry growth models, and more.
Once you run analysis, monitor progress: it moves from queue to pending to completed in the left panel.
Report
Access the analysis results in the Report tab. The left panel lists widgets representing each analysis; drag widgets into the report section to adjust layout or size. Templates are provided for recommend layouts.
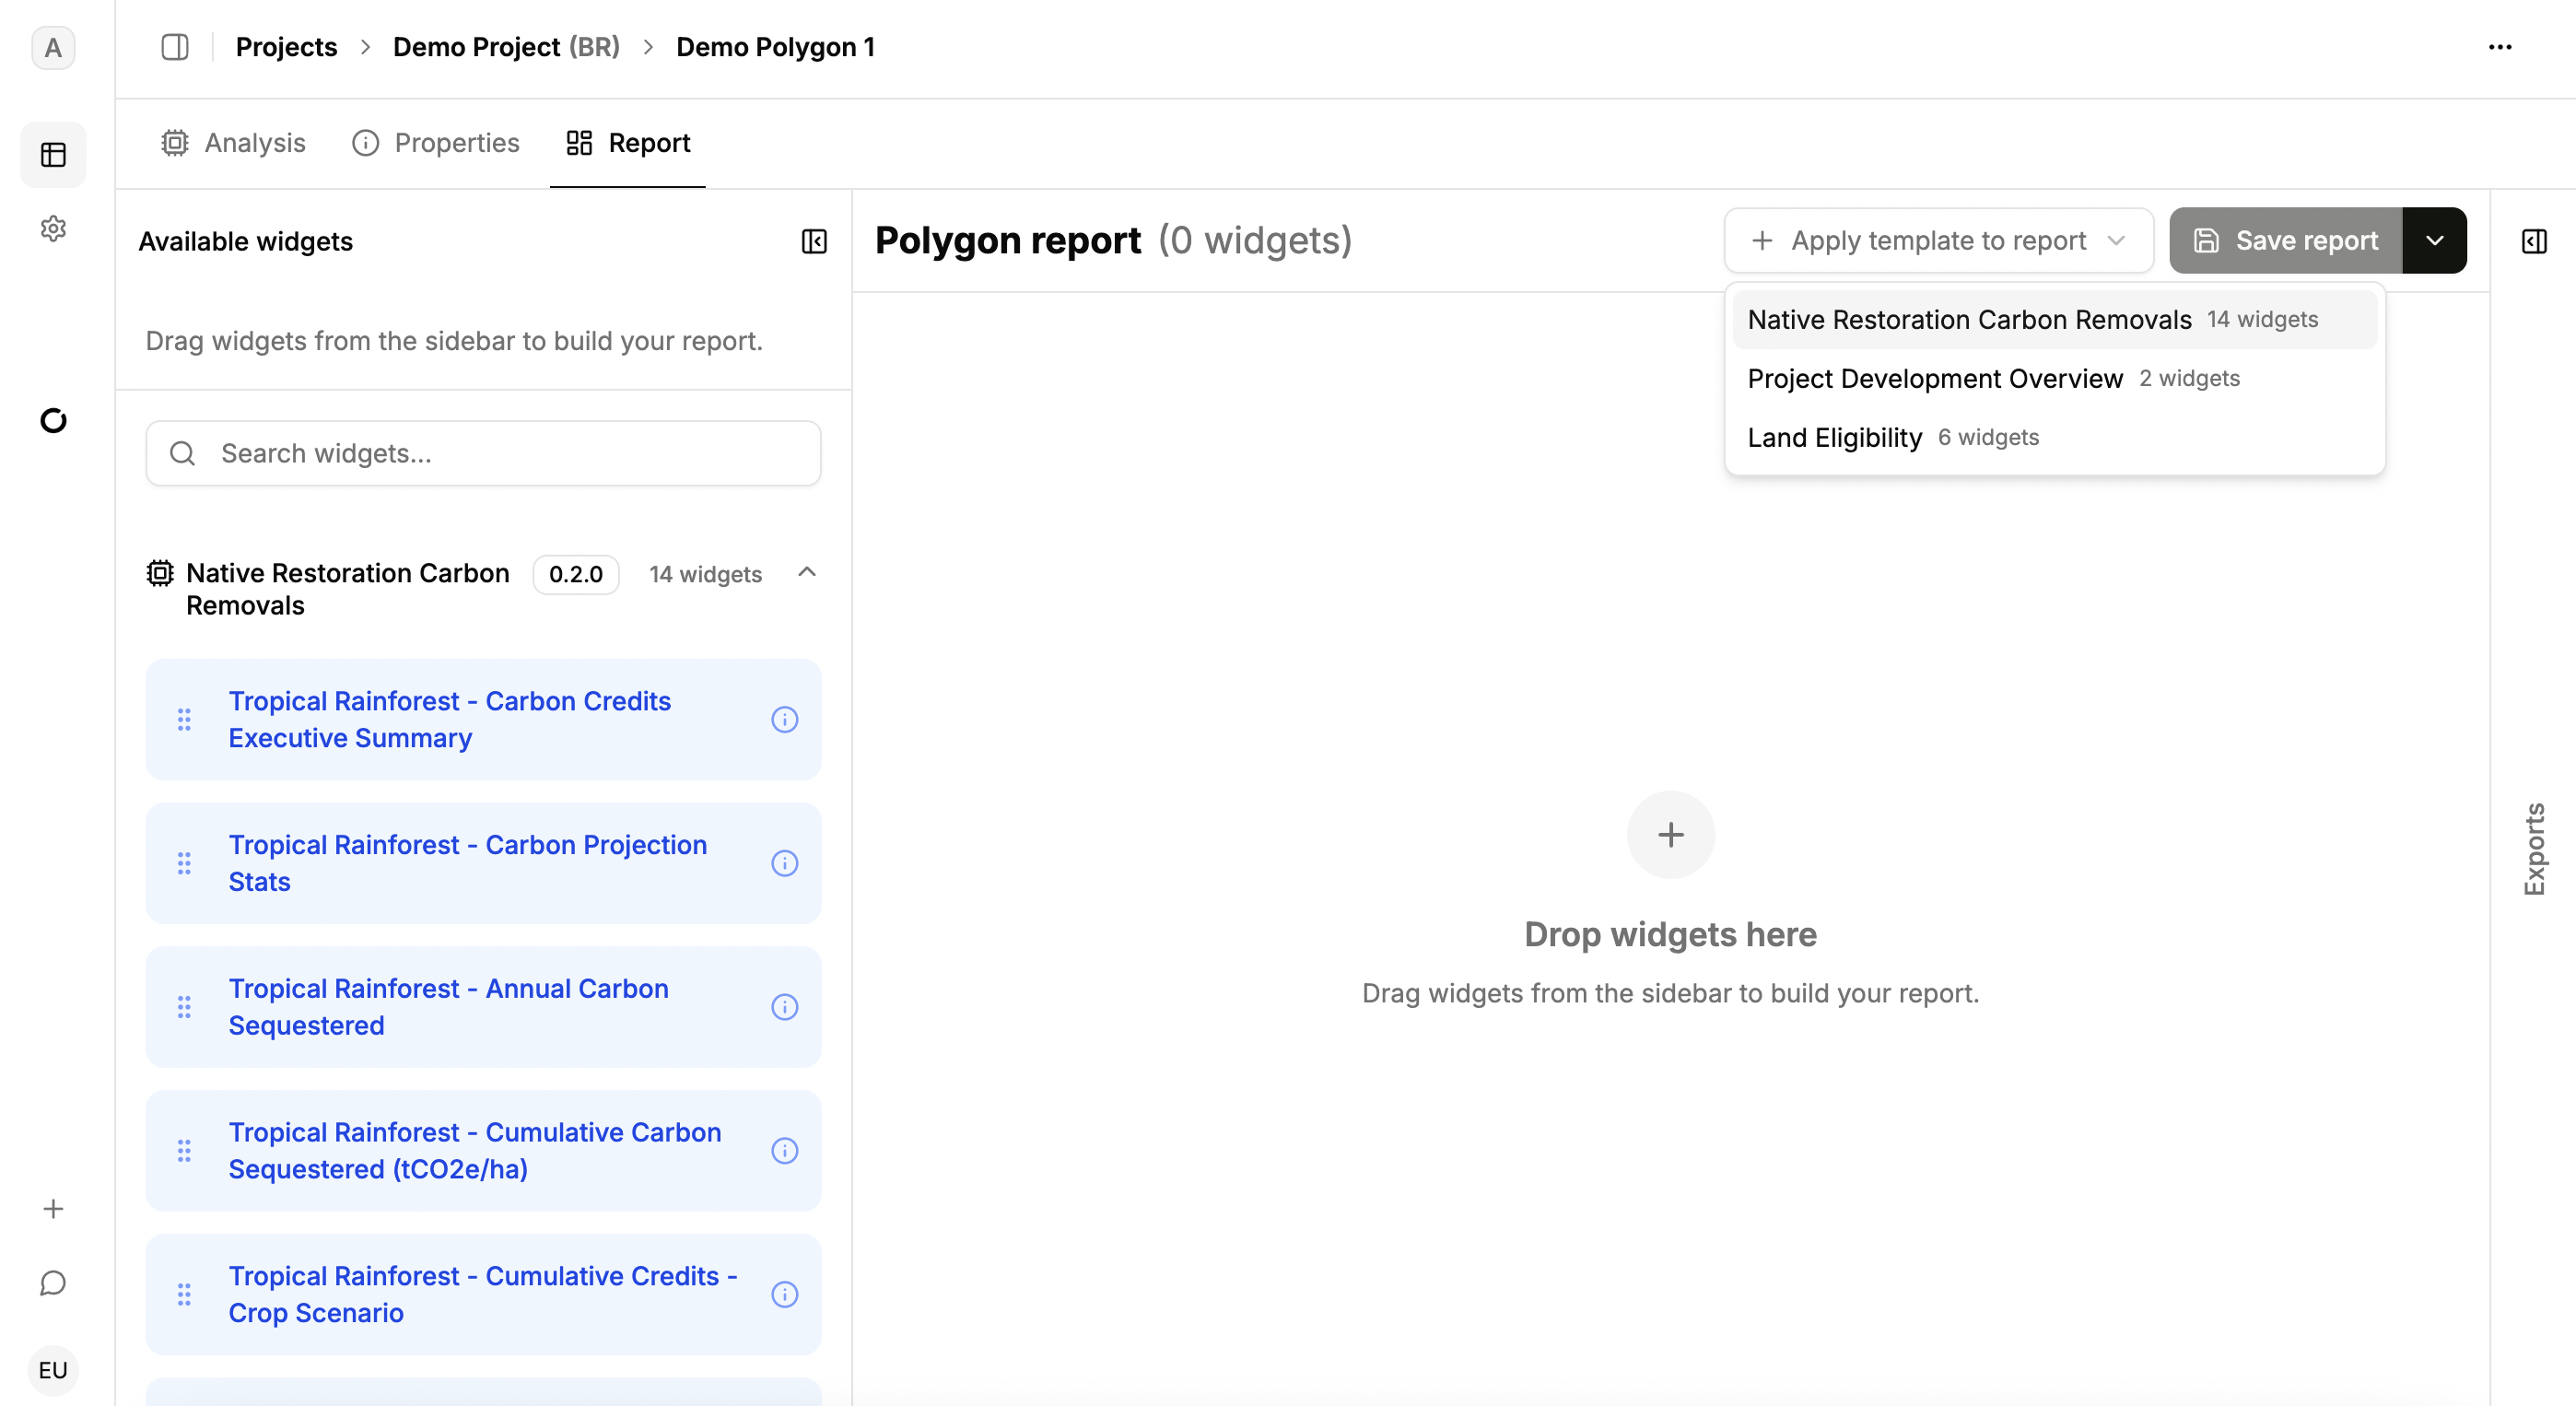
Each analysis has specific templates; multiple templates can be used per report.
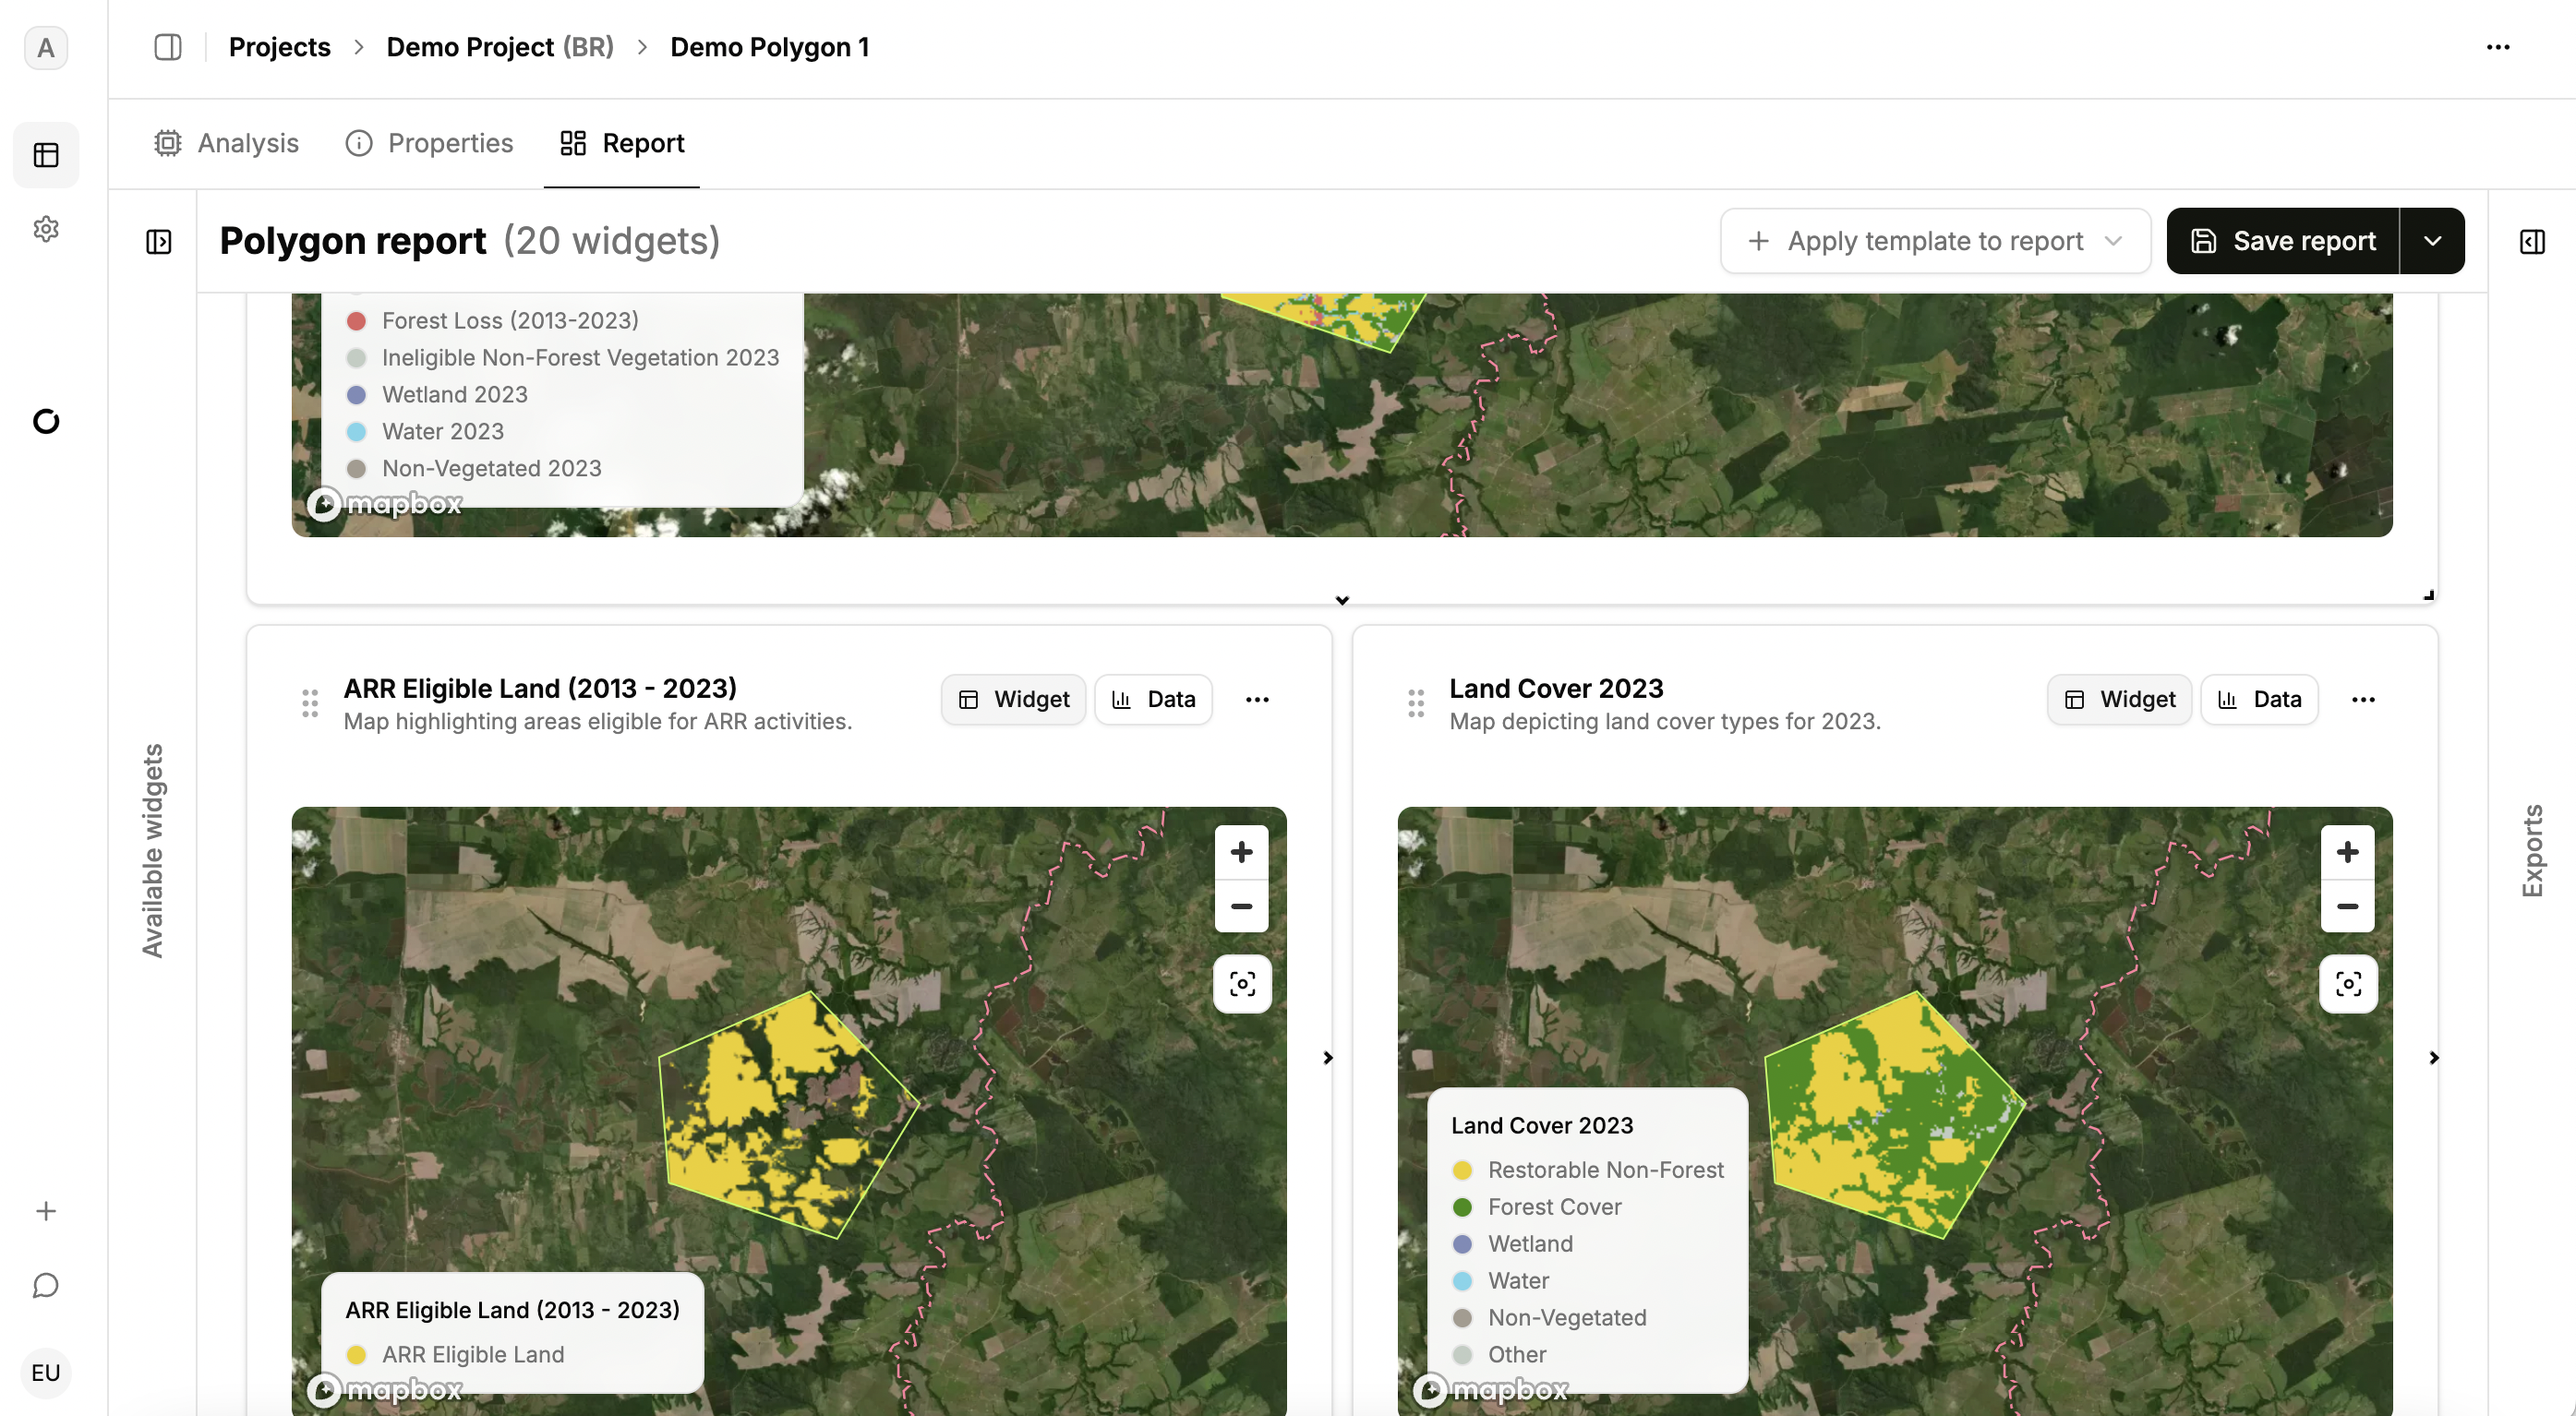
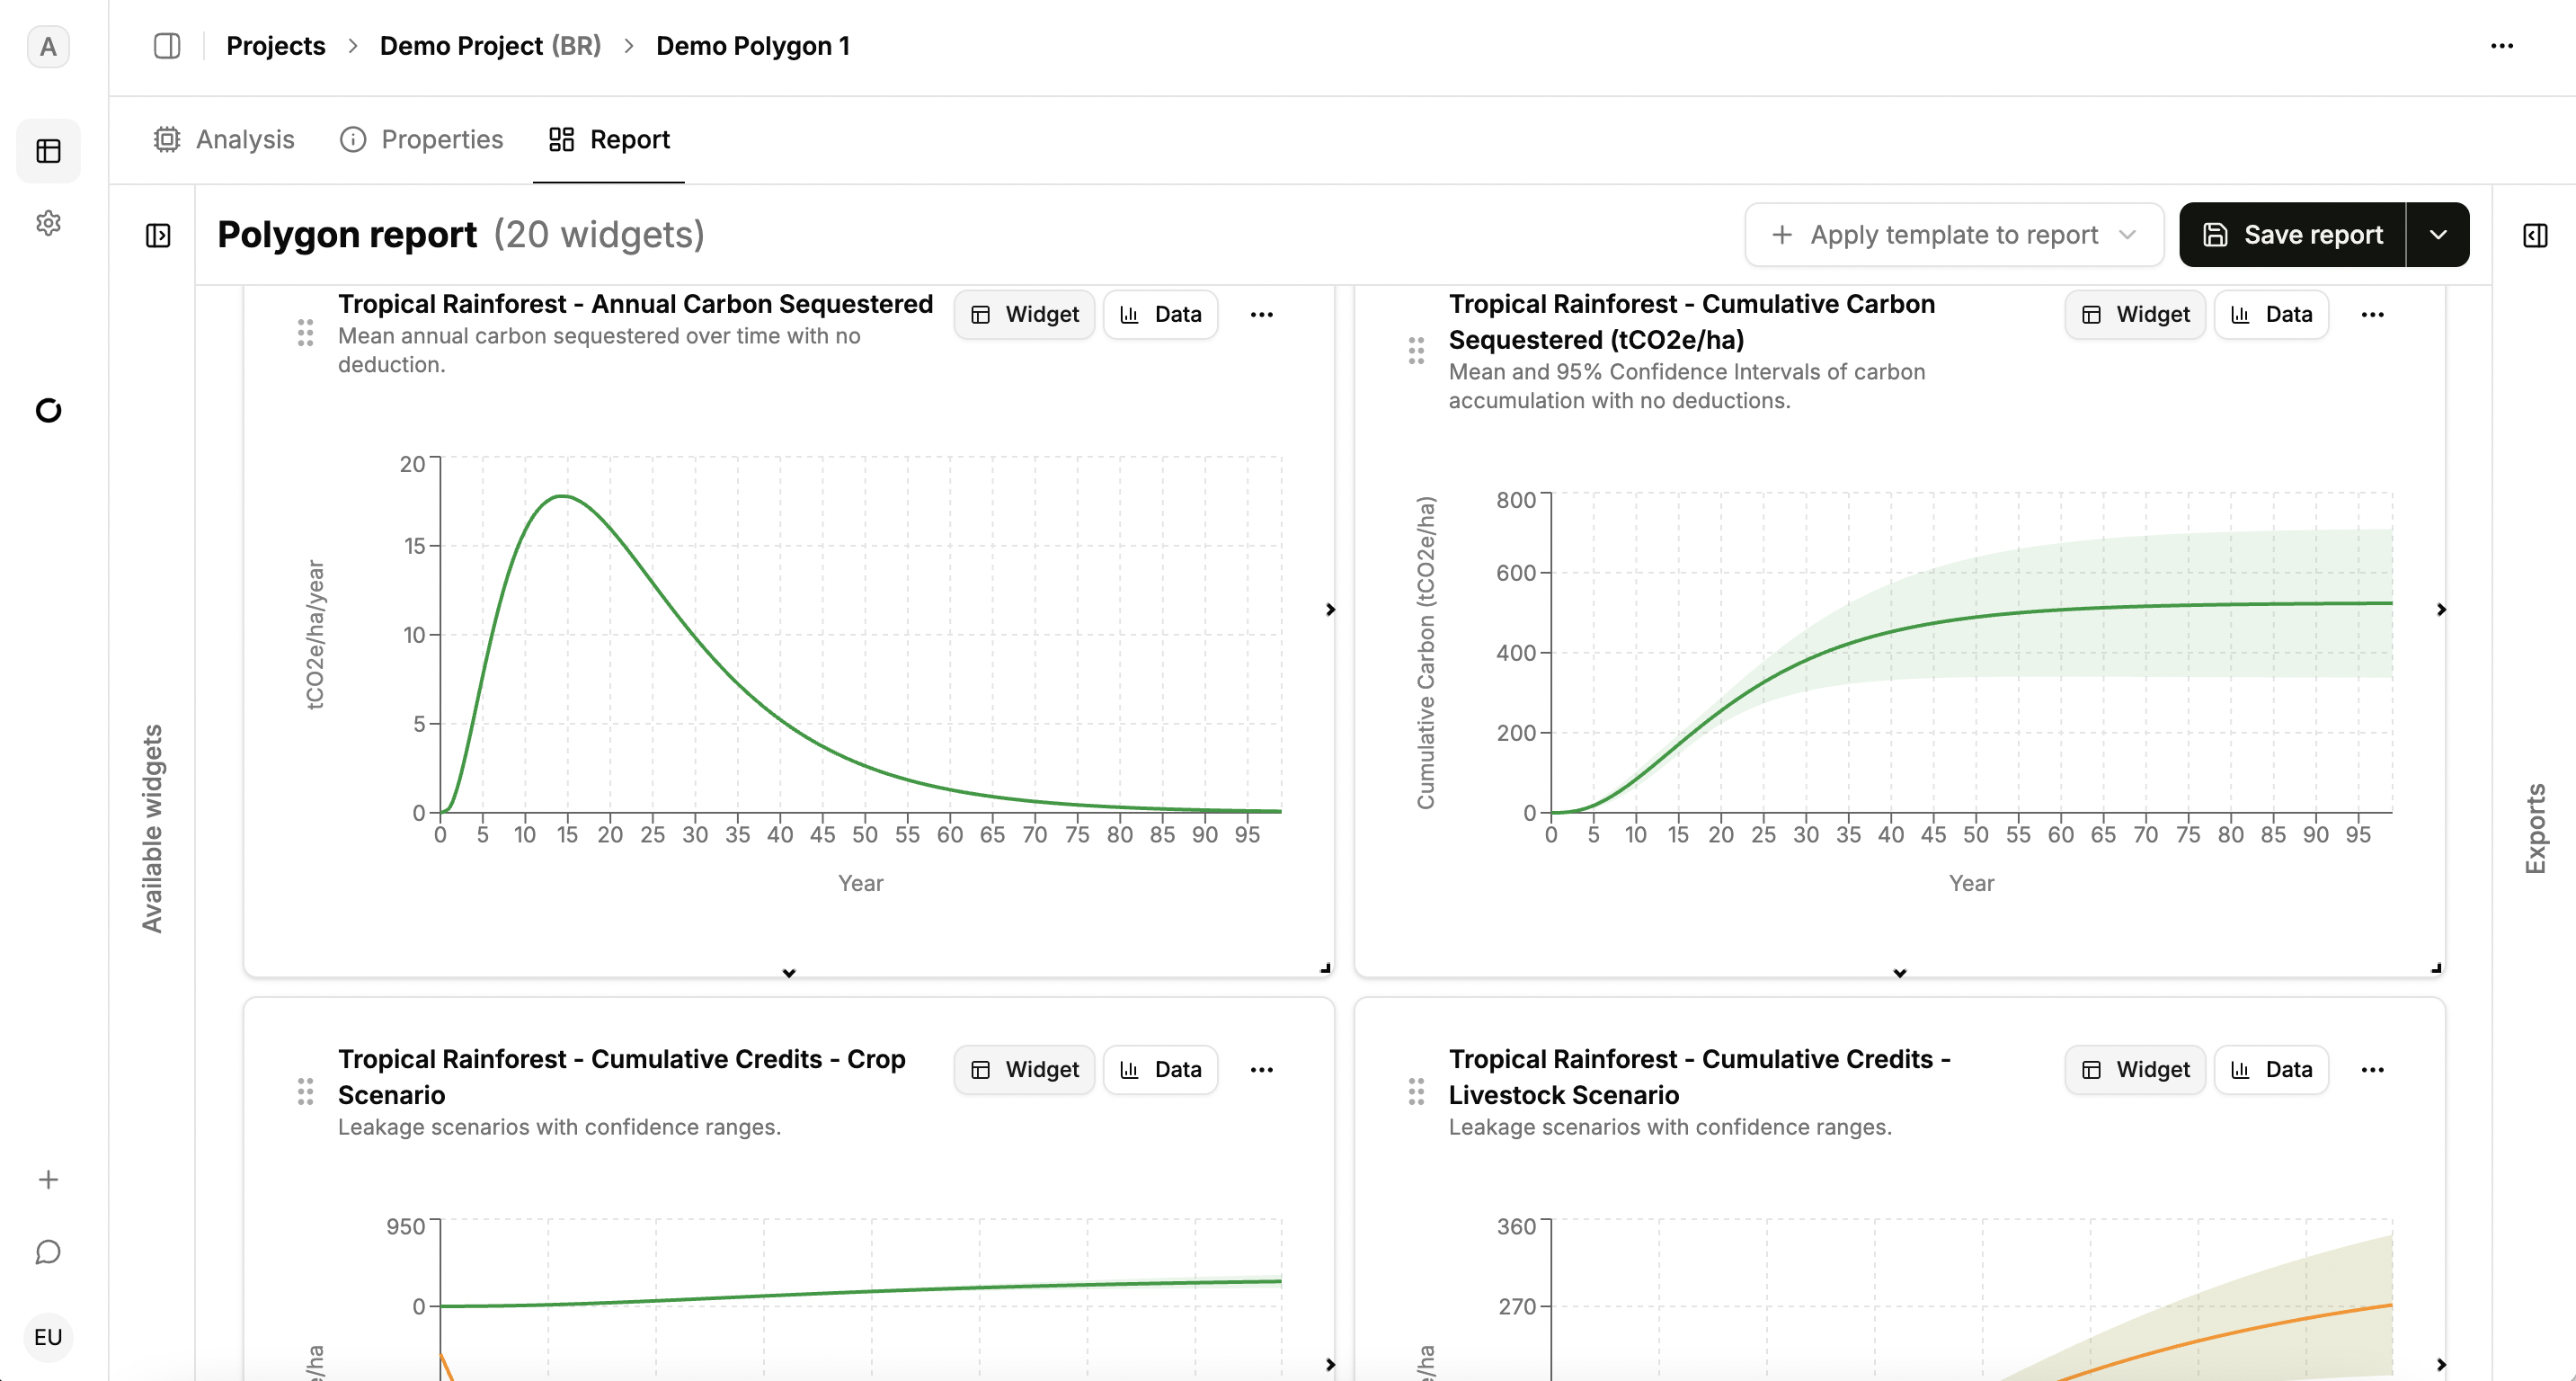
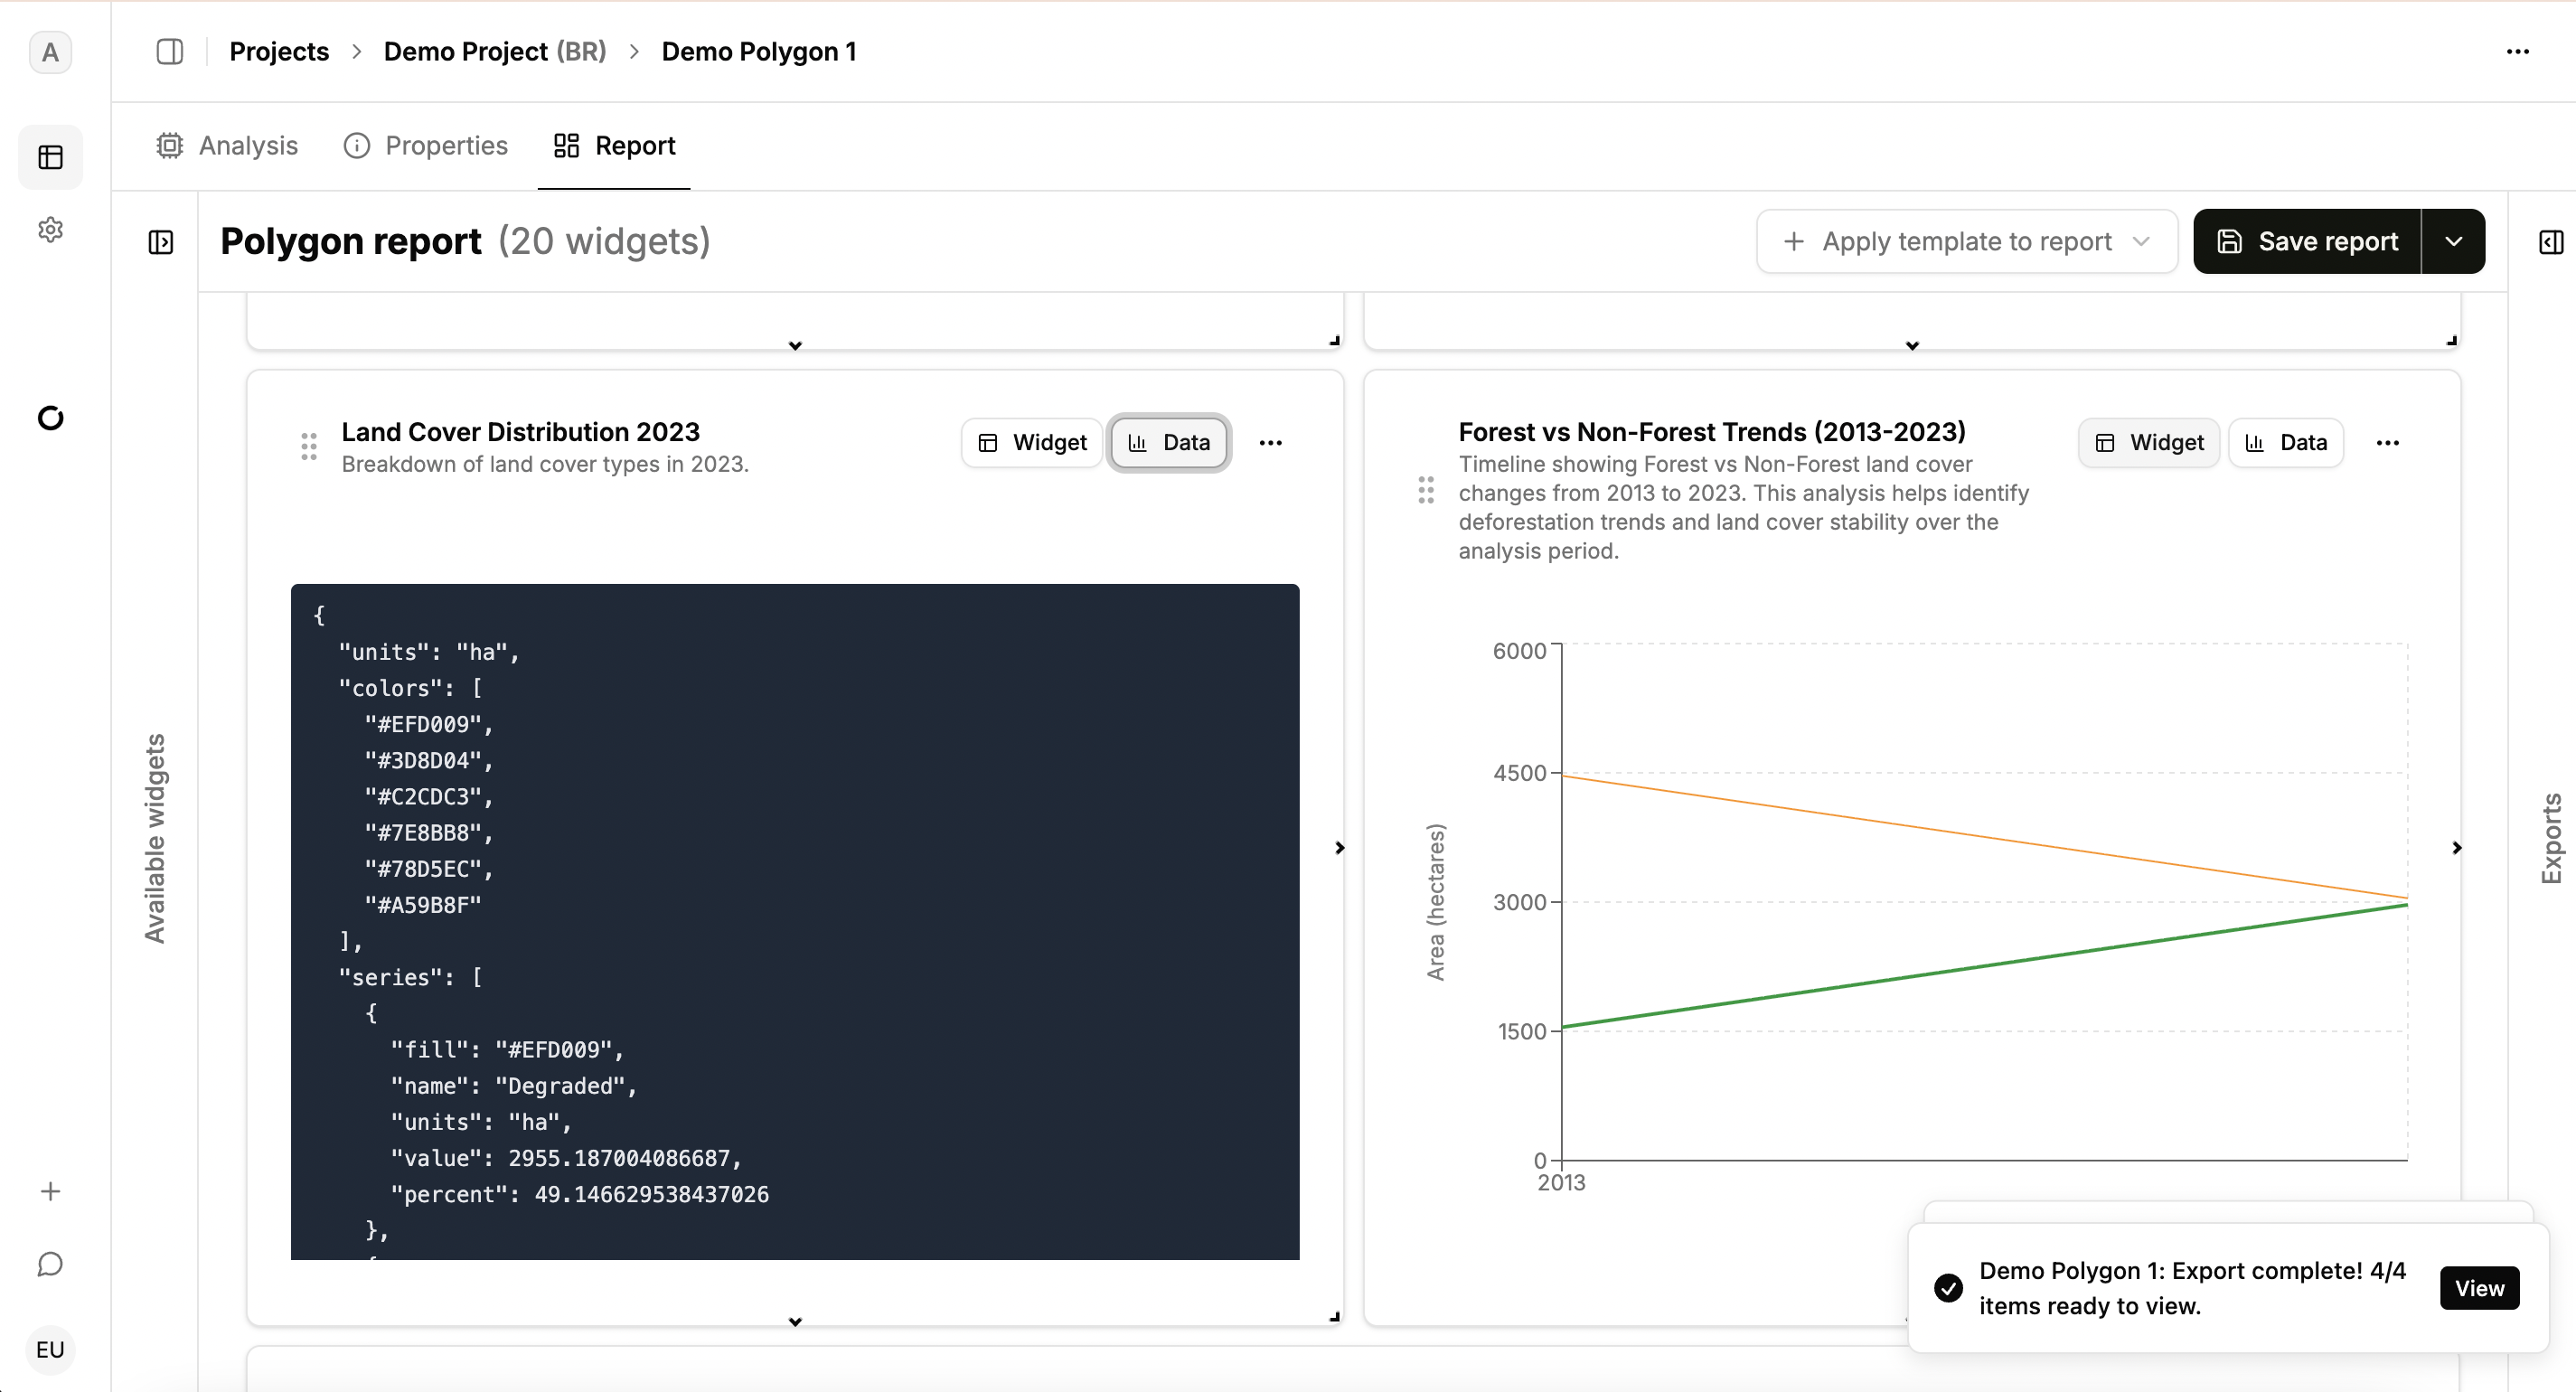
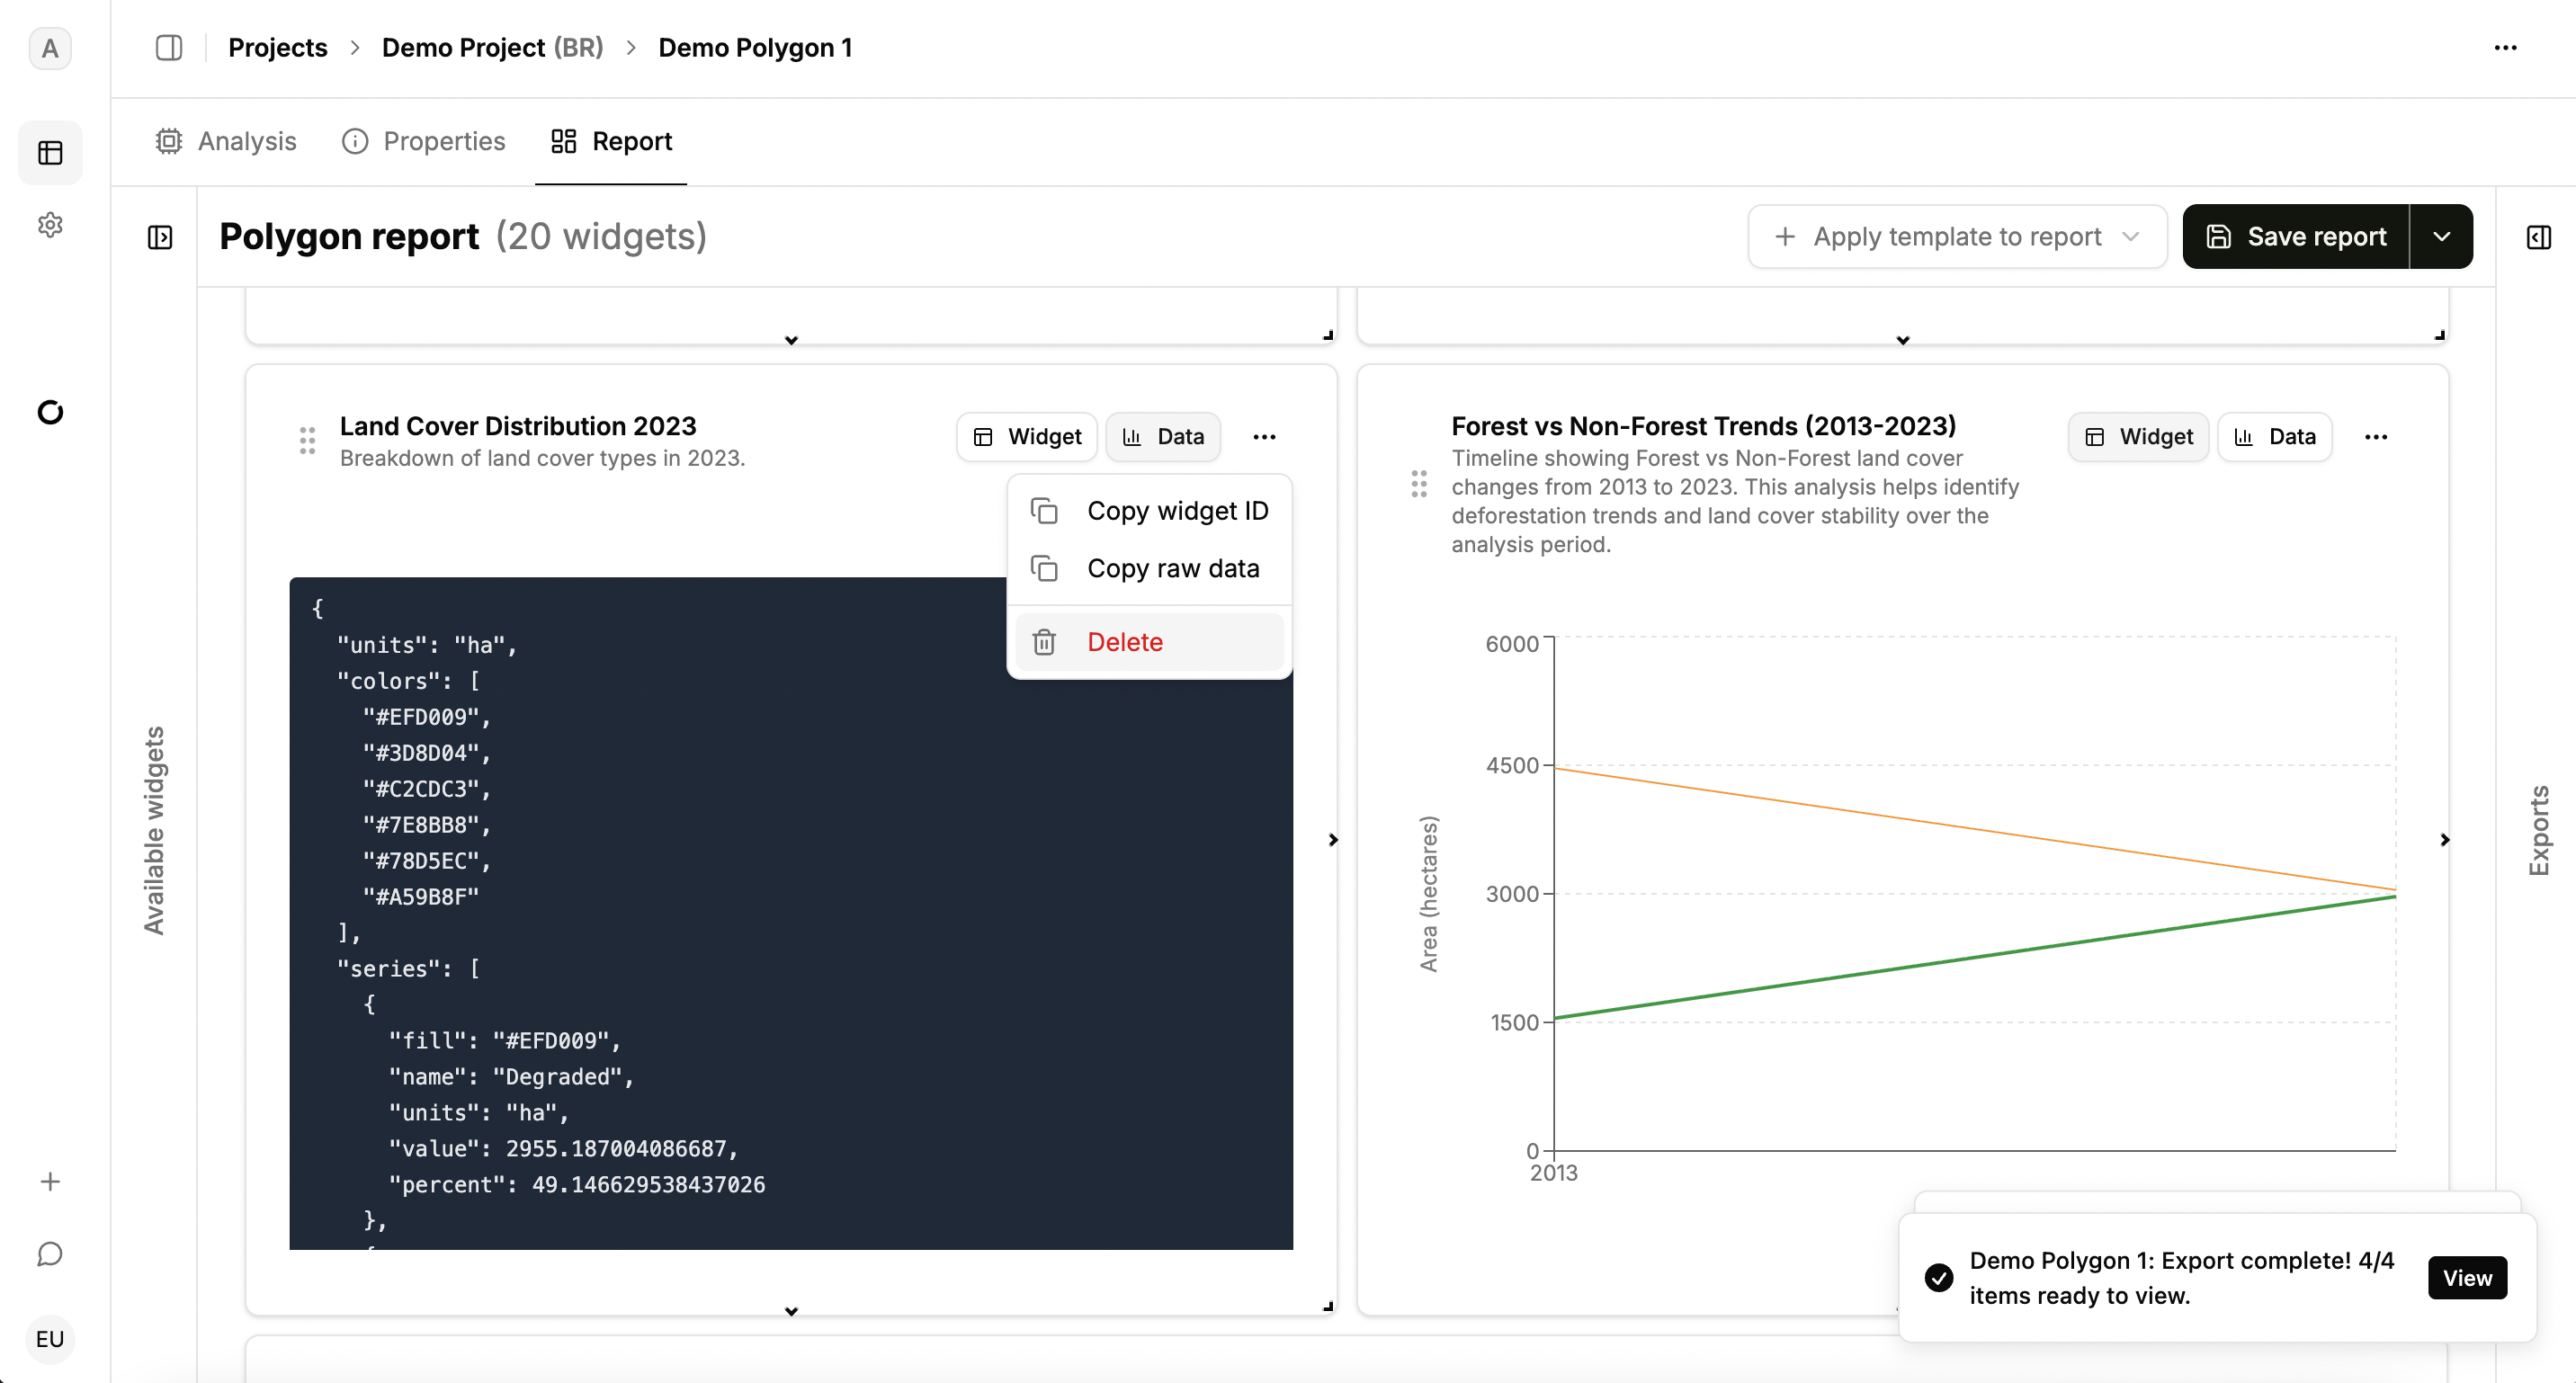
Widgets can be moved and resized. Data view shows the raw analysis outputs.
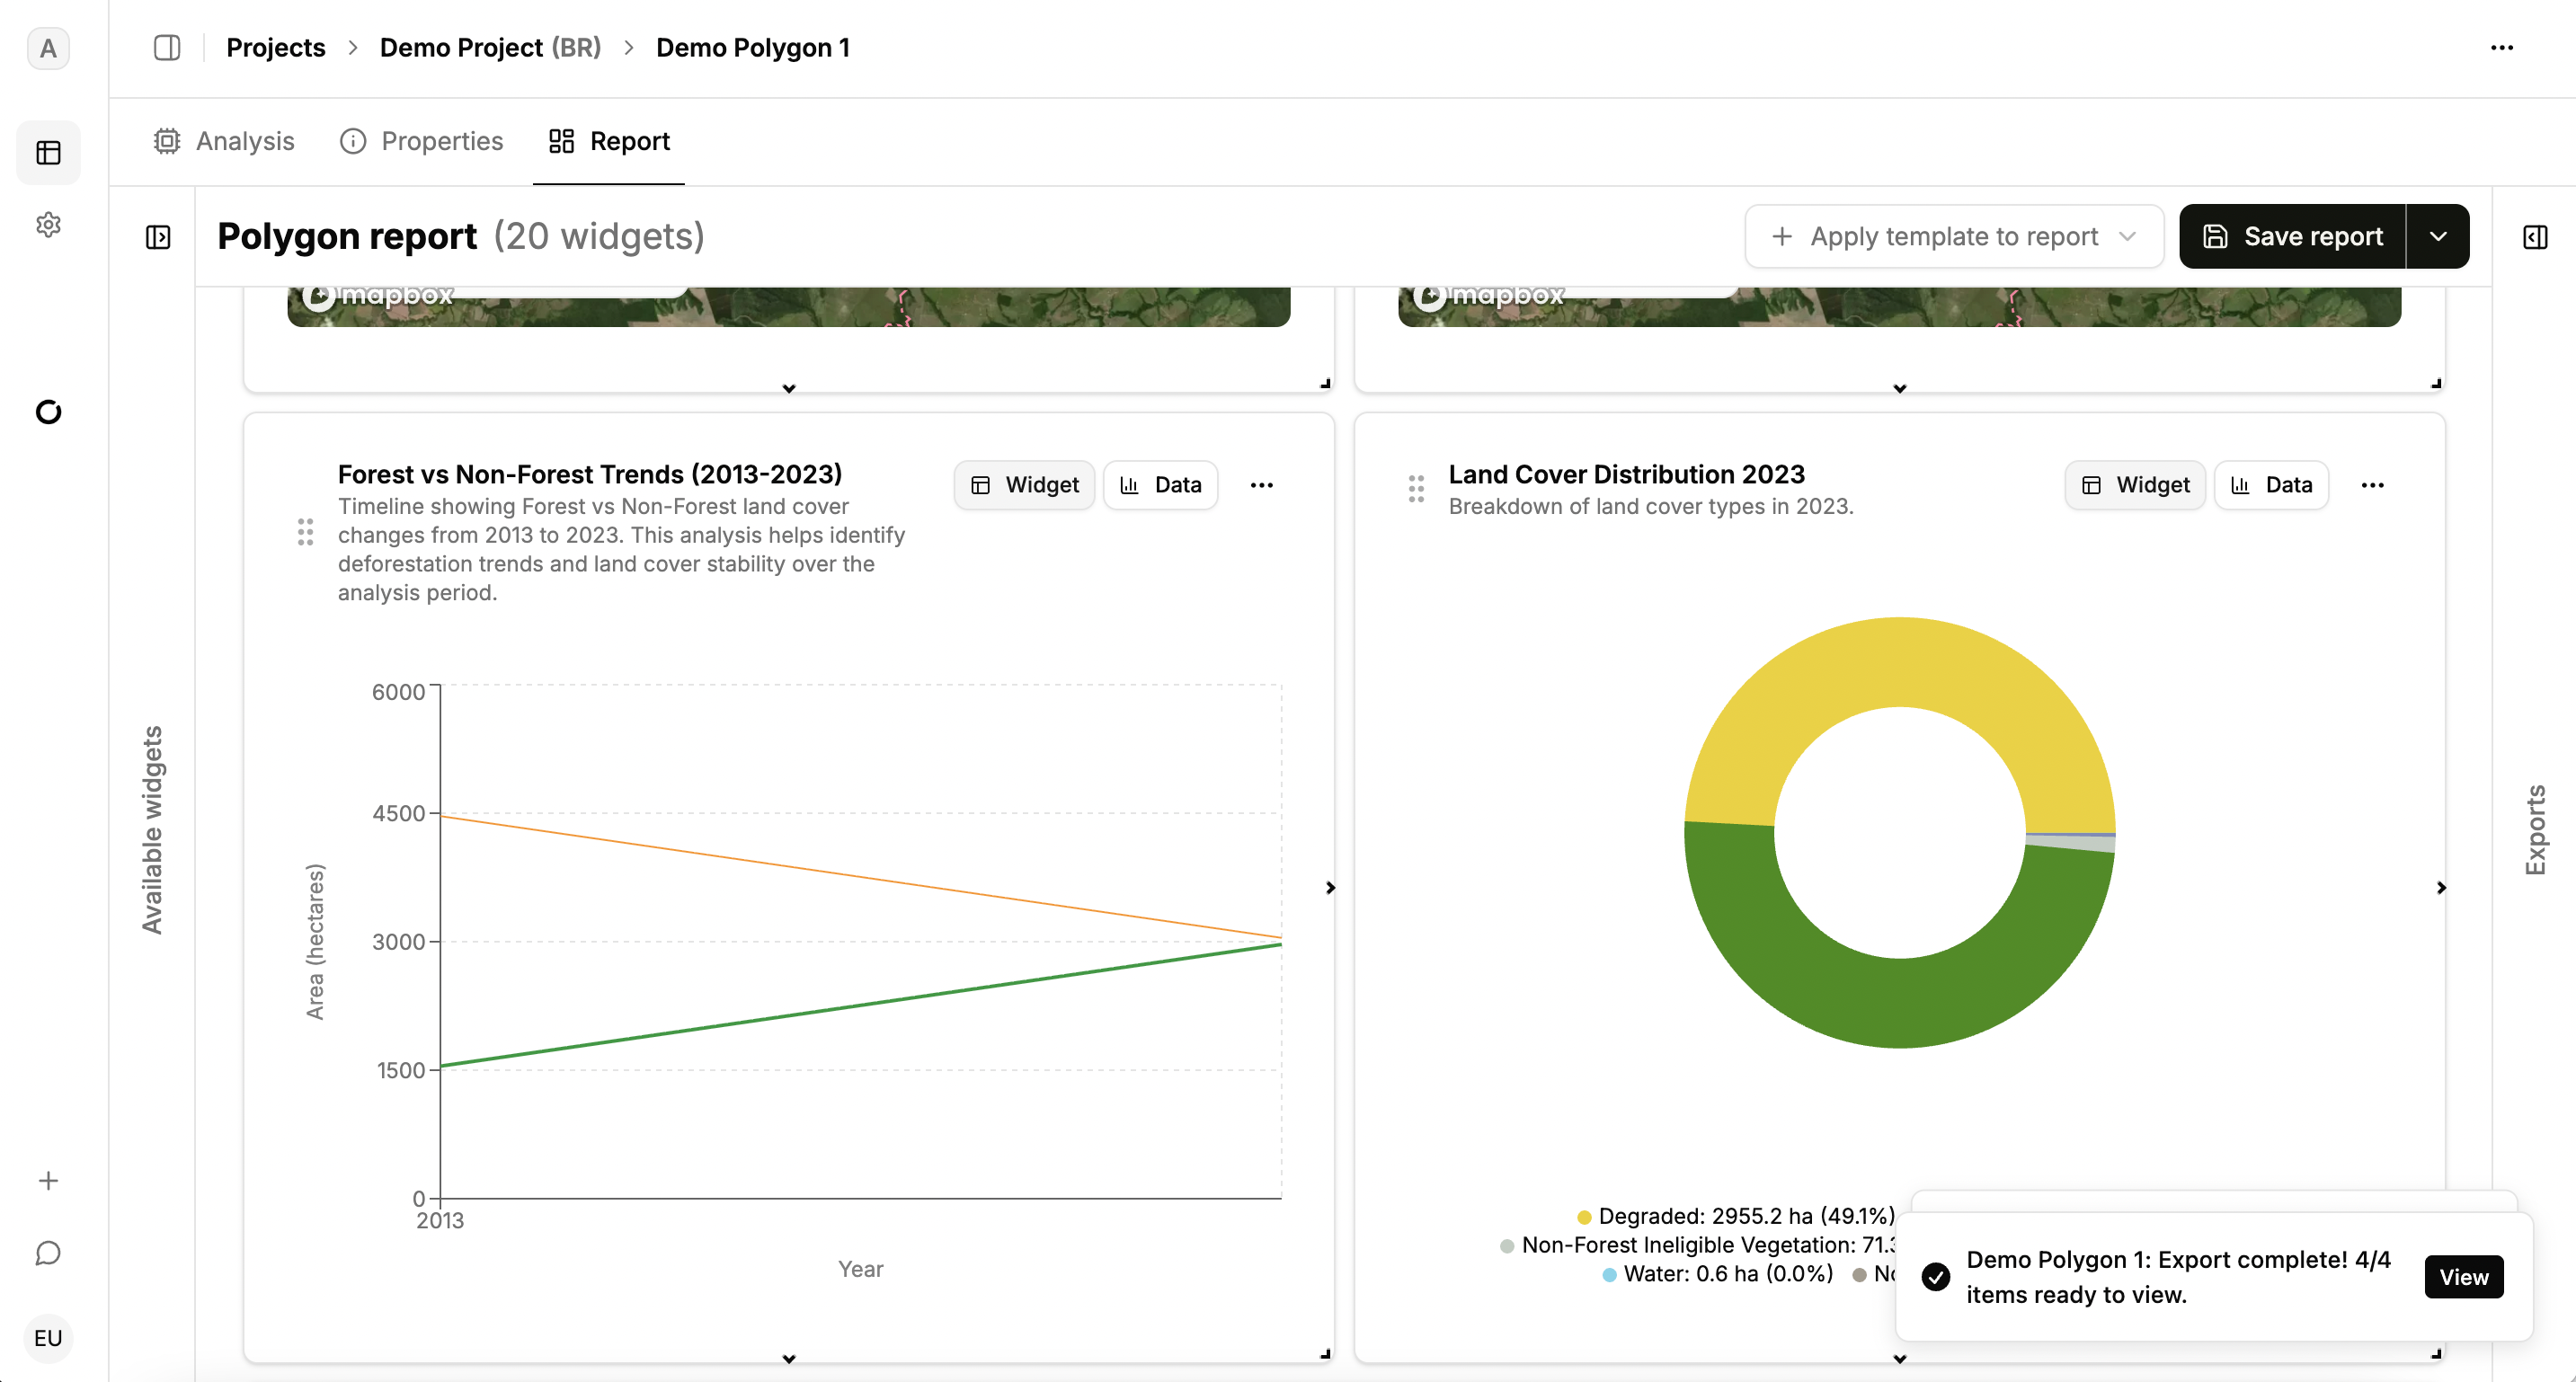
Widgets are generated by taking raw outputs from the analysis and displaying them in set formats such as data tables, graphs, or maps. However, the raw data underlying these widgets can be viewed by toggling to the data view on any widget.
Text widgets use an LLM to interpret results narratively.
Delete any widget using the three dots menu; this removes it from view but not from data, and you can restore it later if needed.
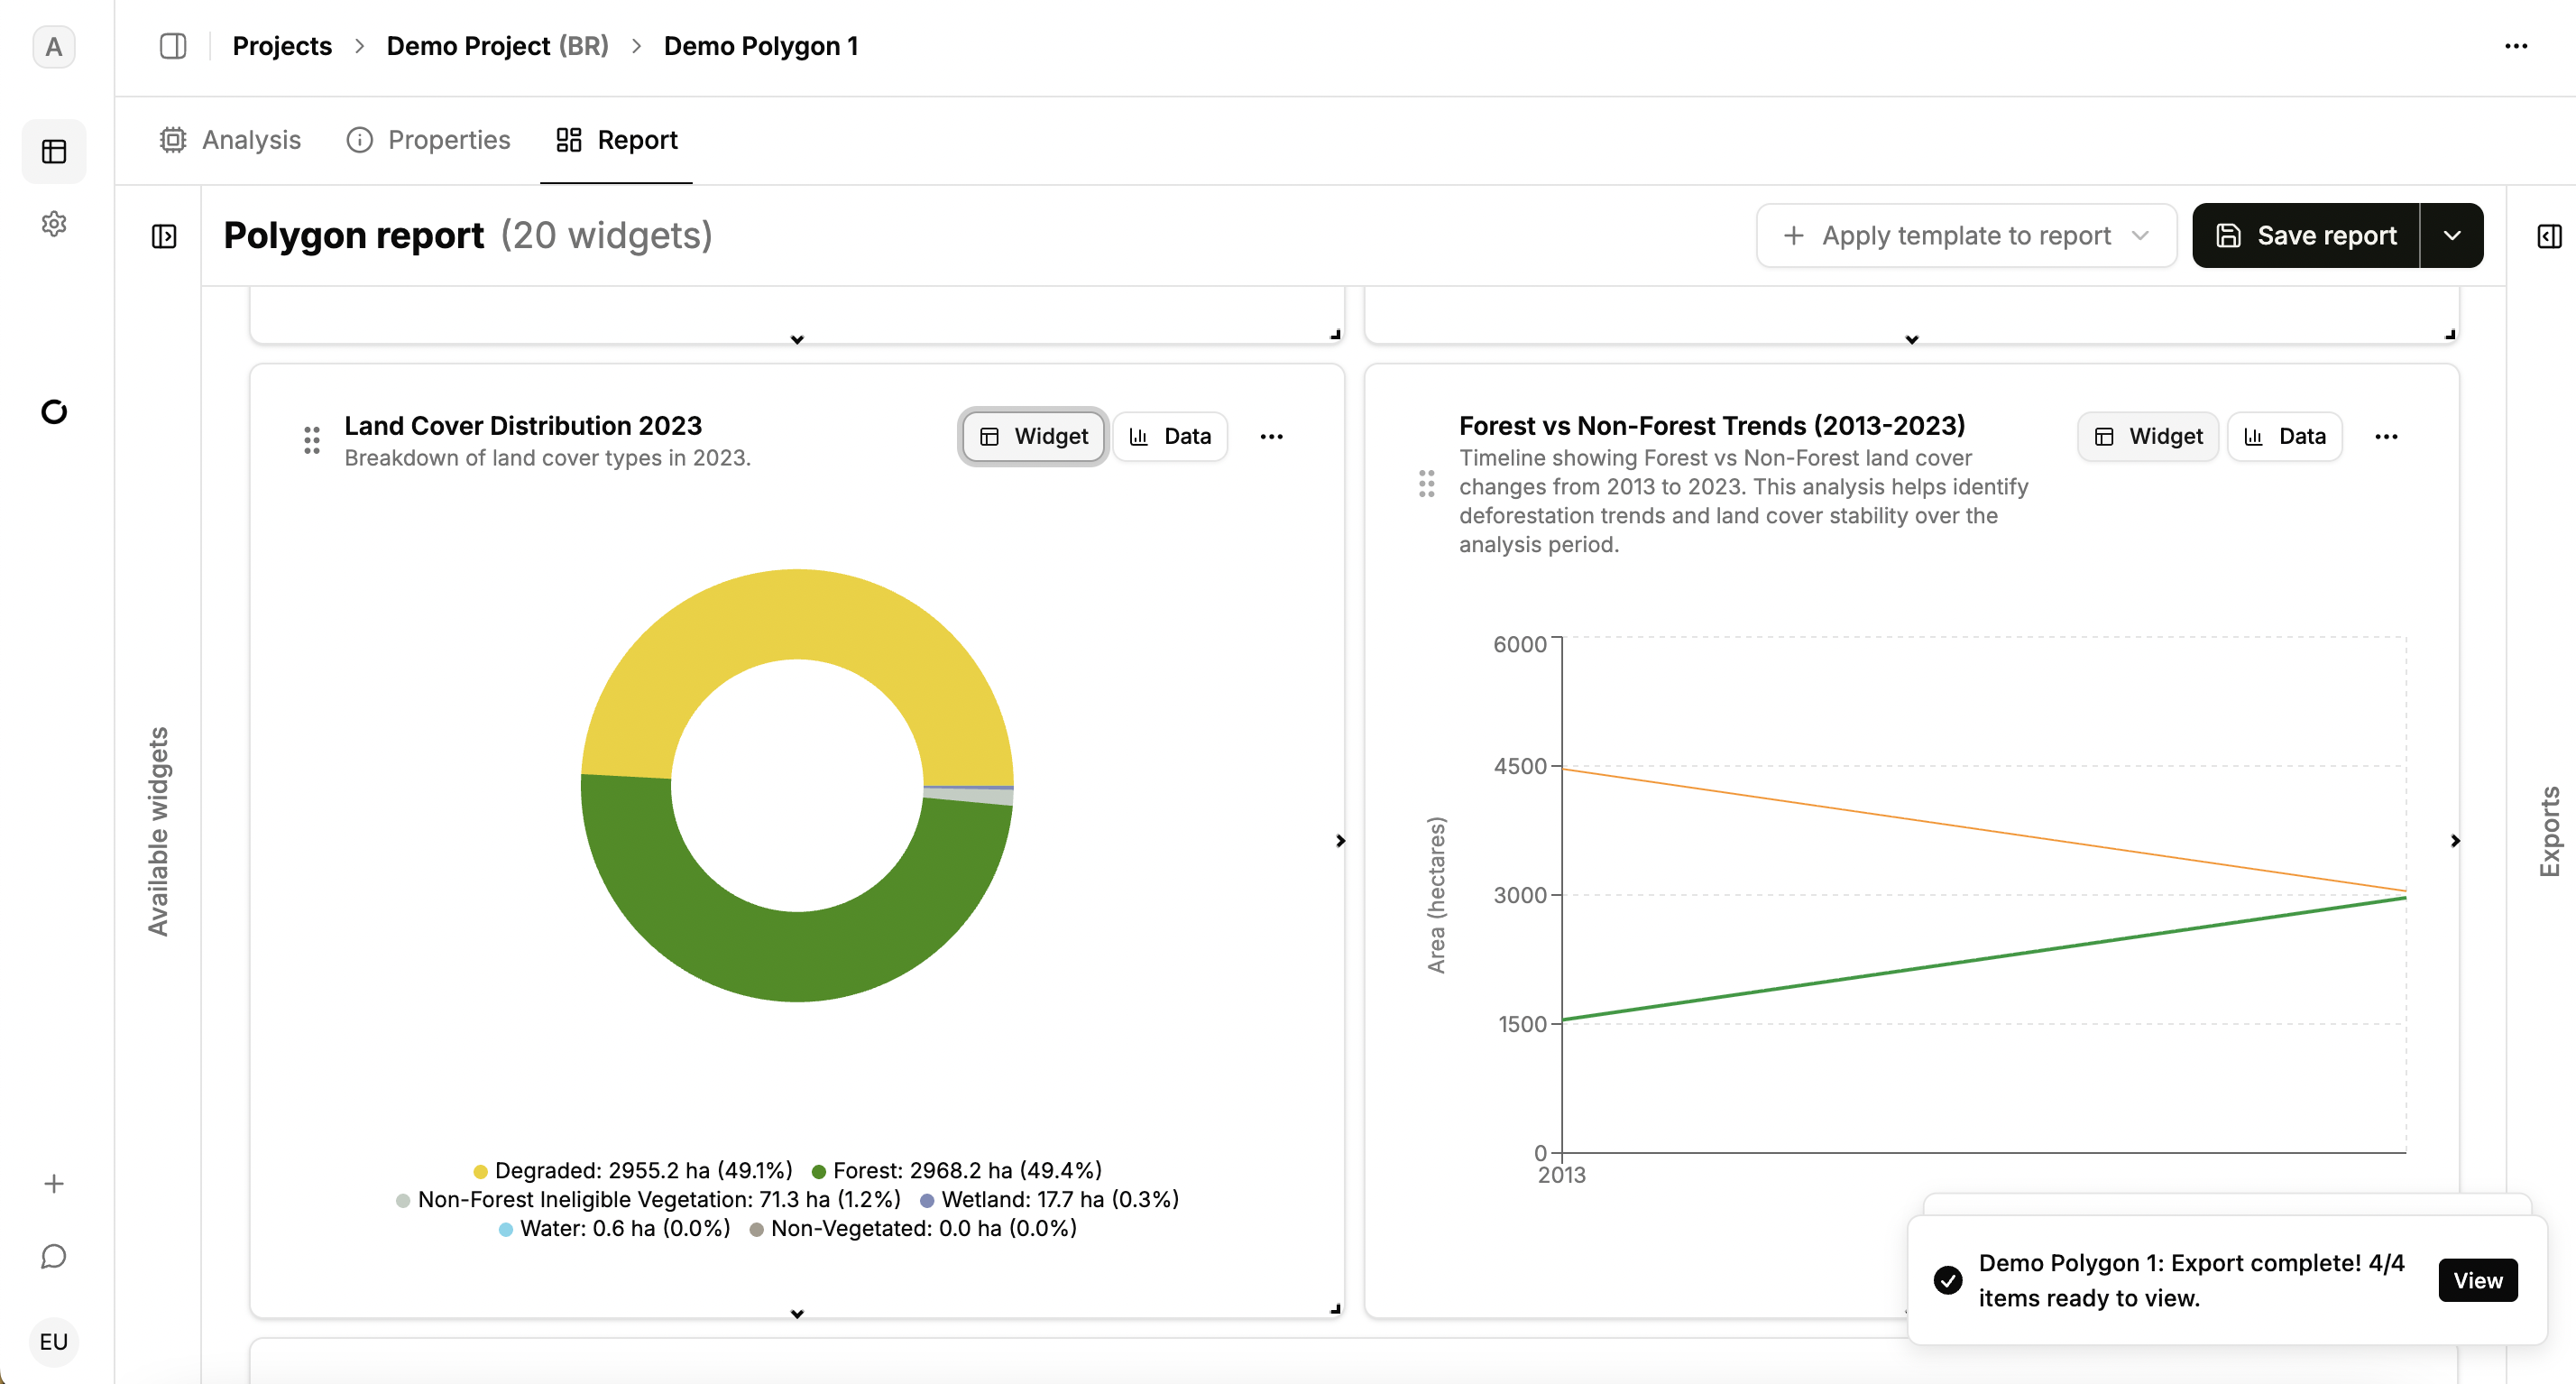
Export
Starter Tier users can export PDF reports and widget data. After saving a report, use the export dropdown.
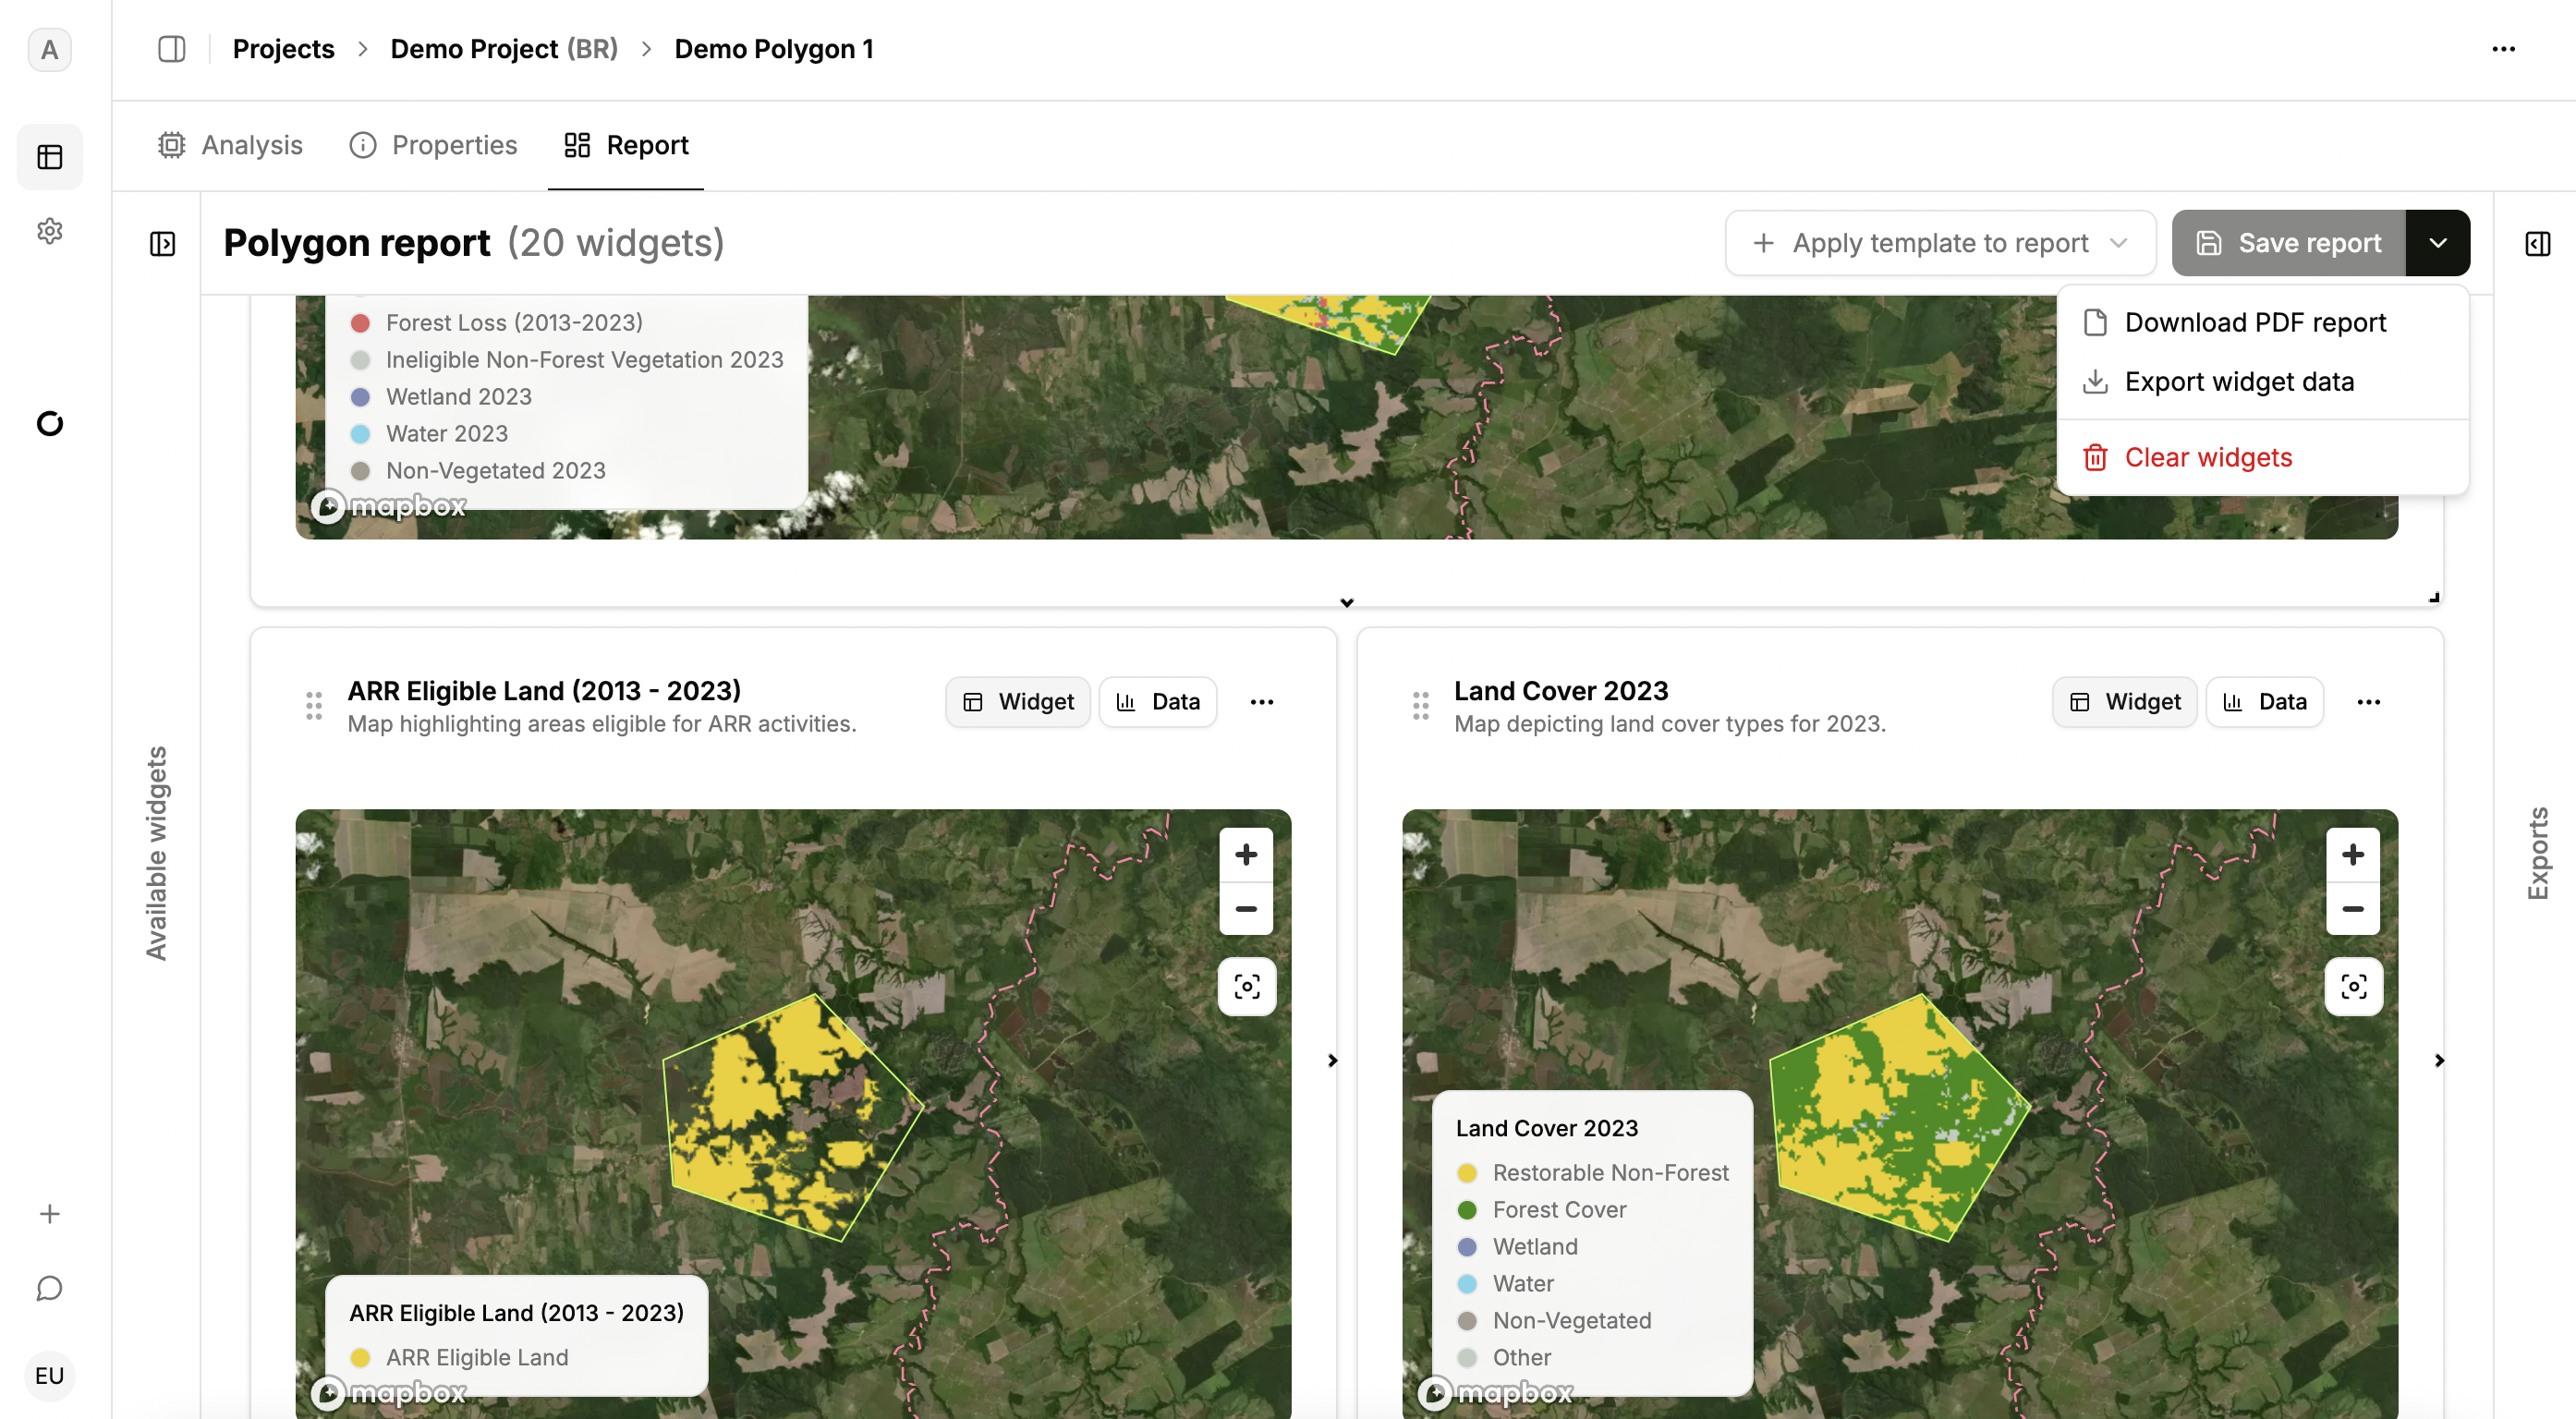
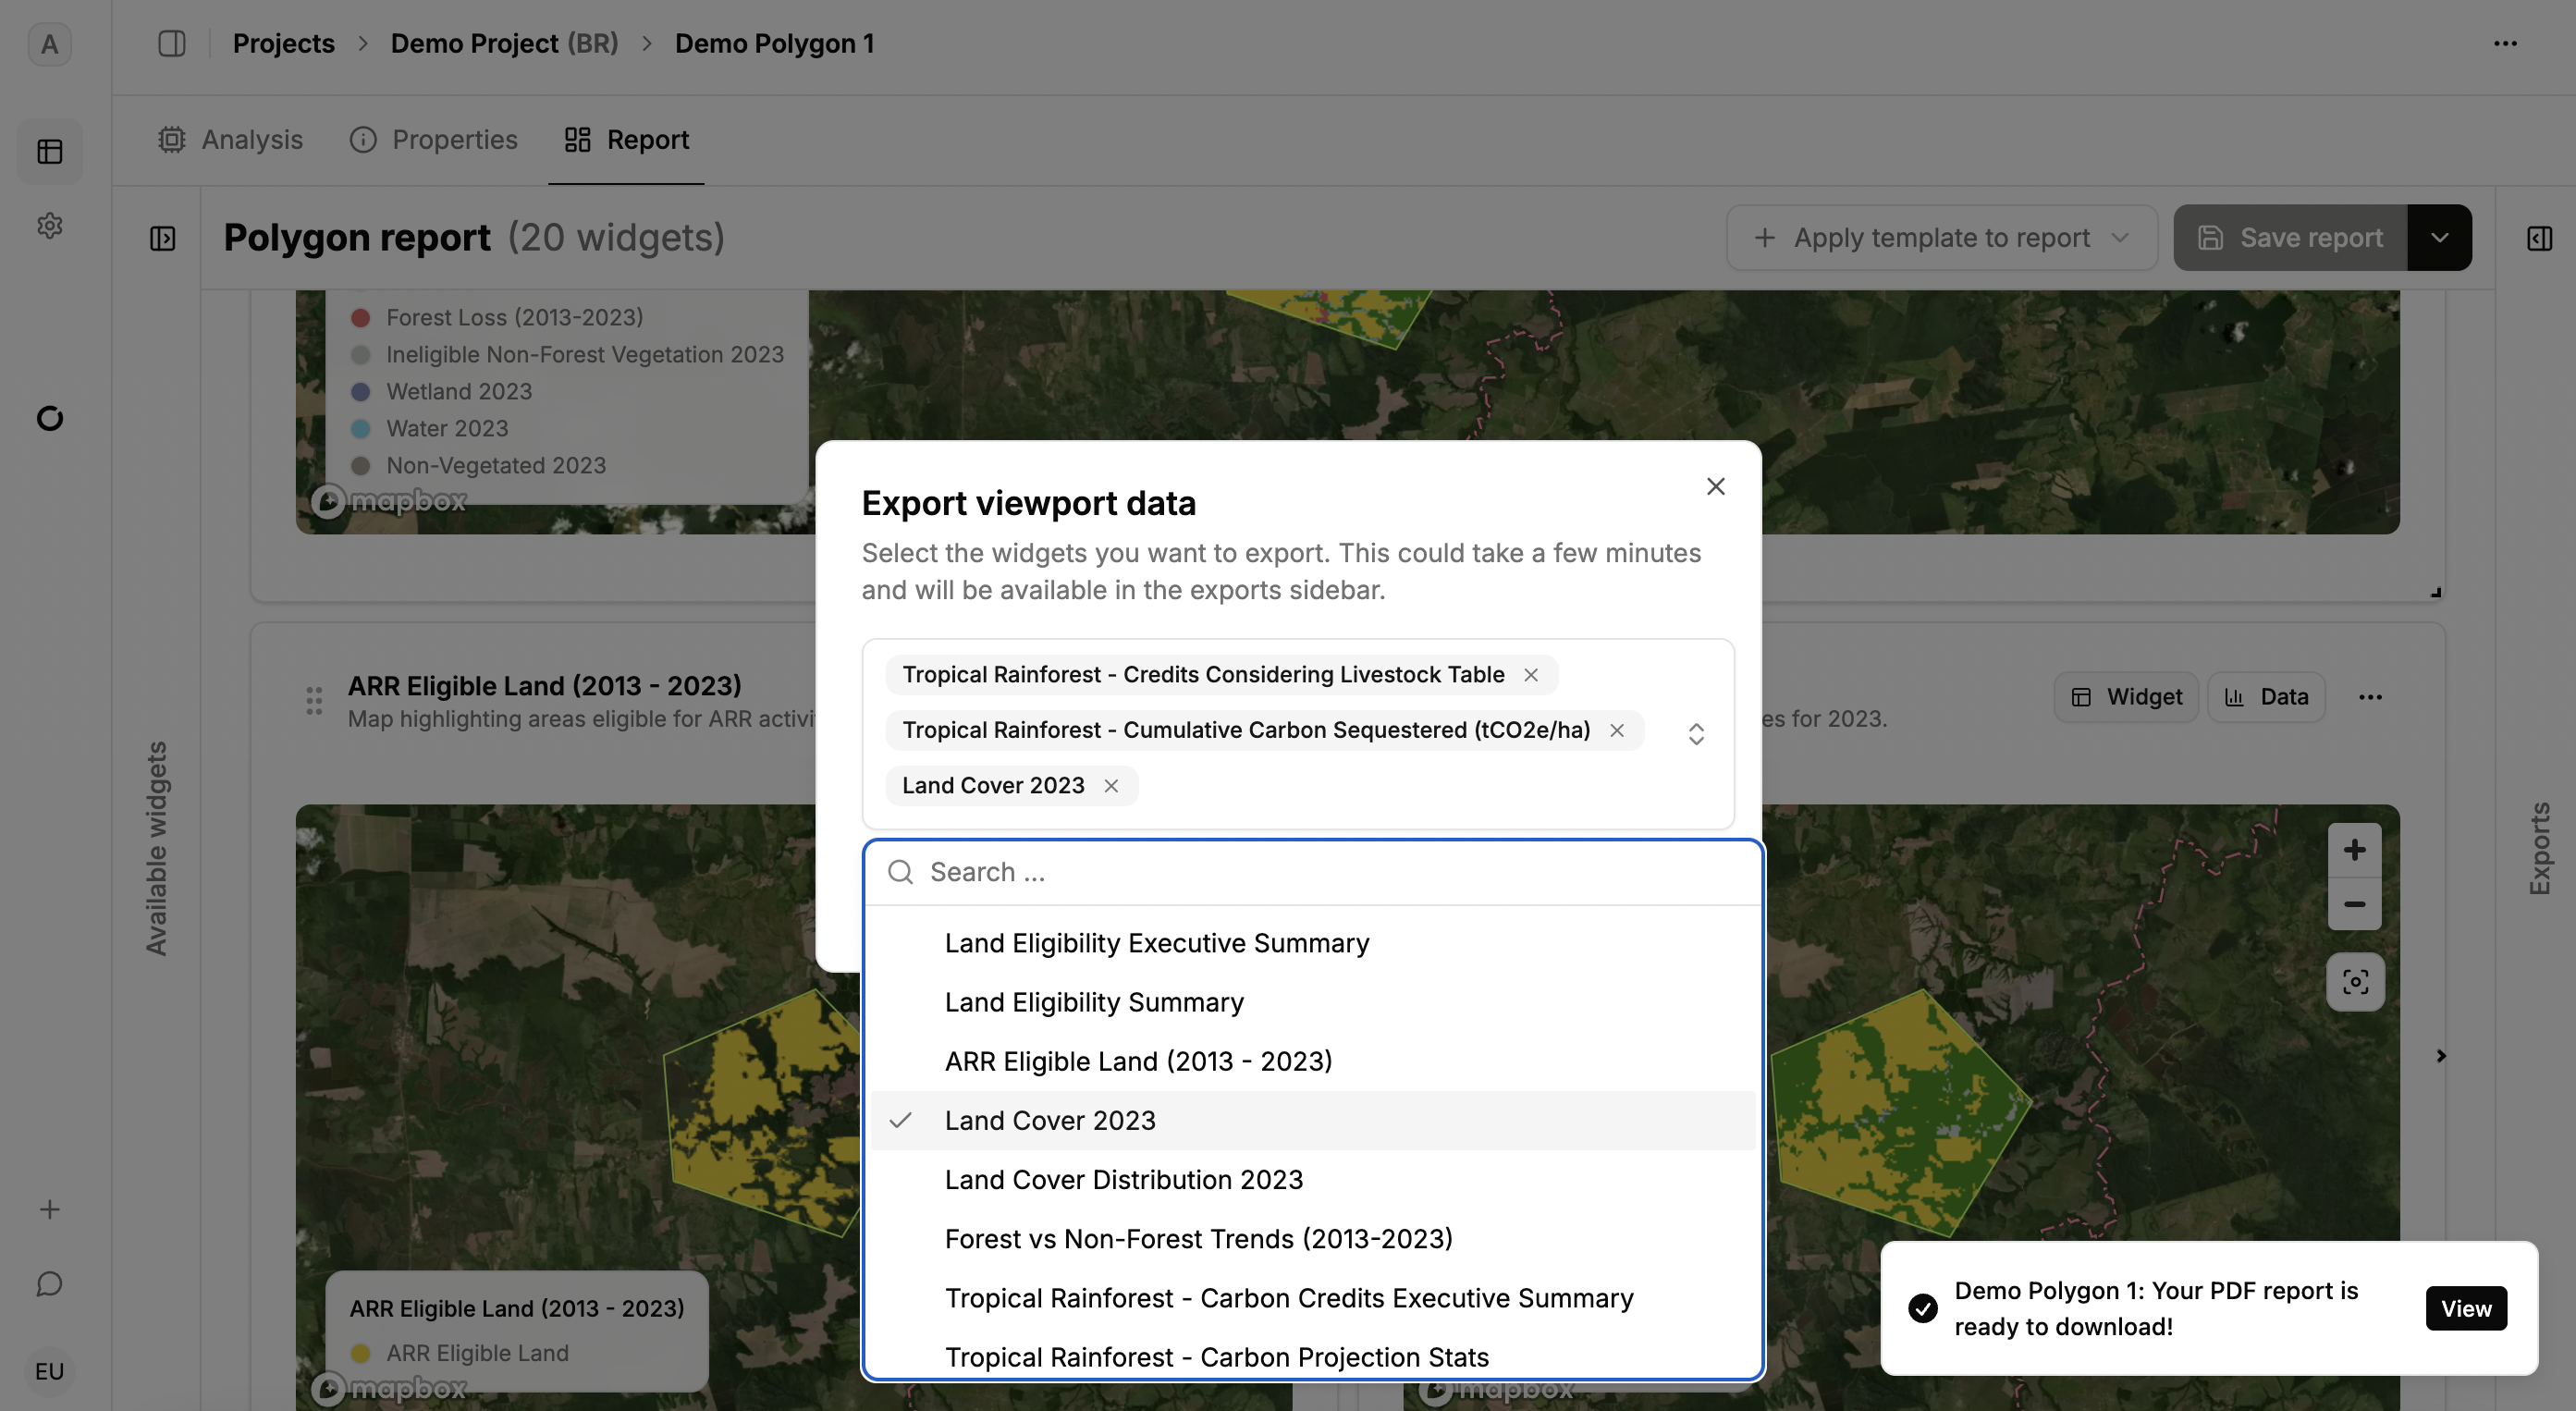
Pick which widgets to export. Downloads are accessed in the export drawer on the right, where you can track export status. Download completed PDF reports for sharing. Export widget data in CSV or PNG formats.
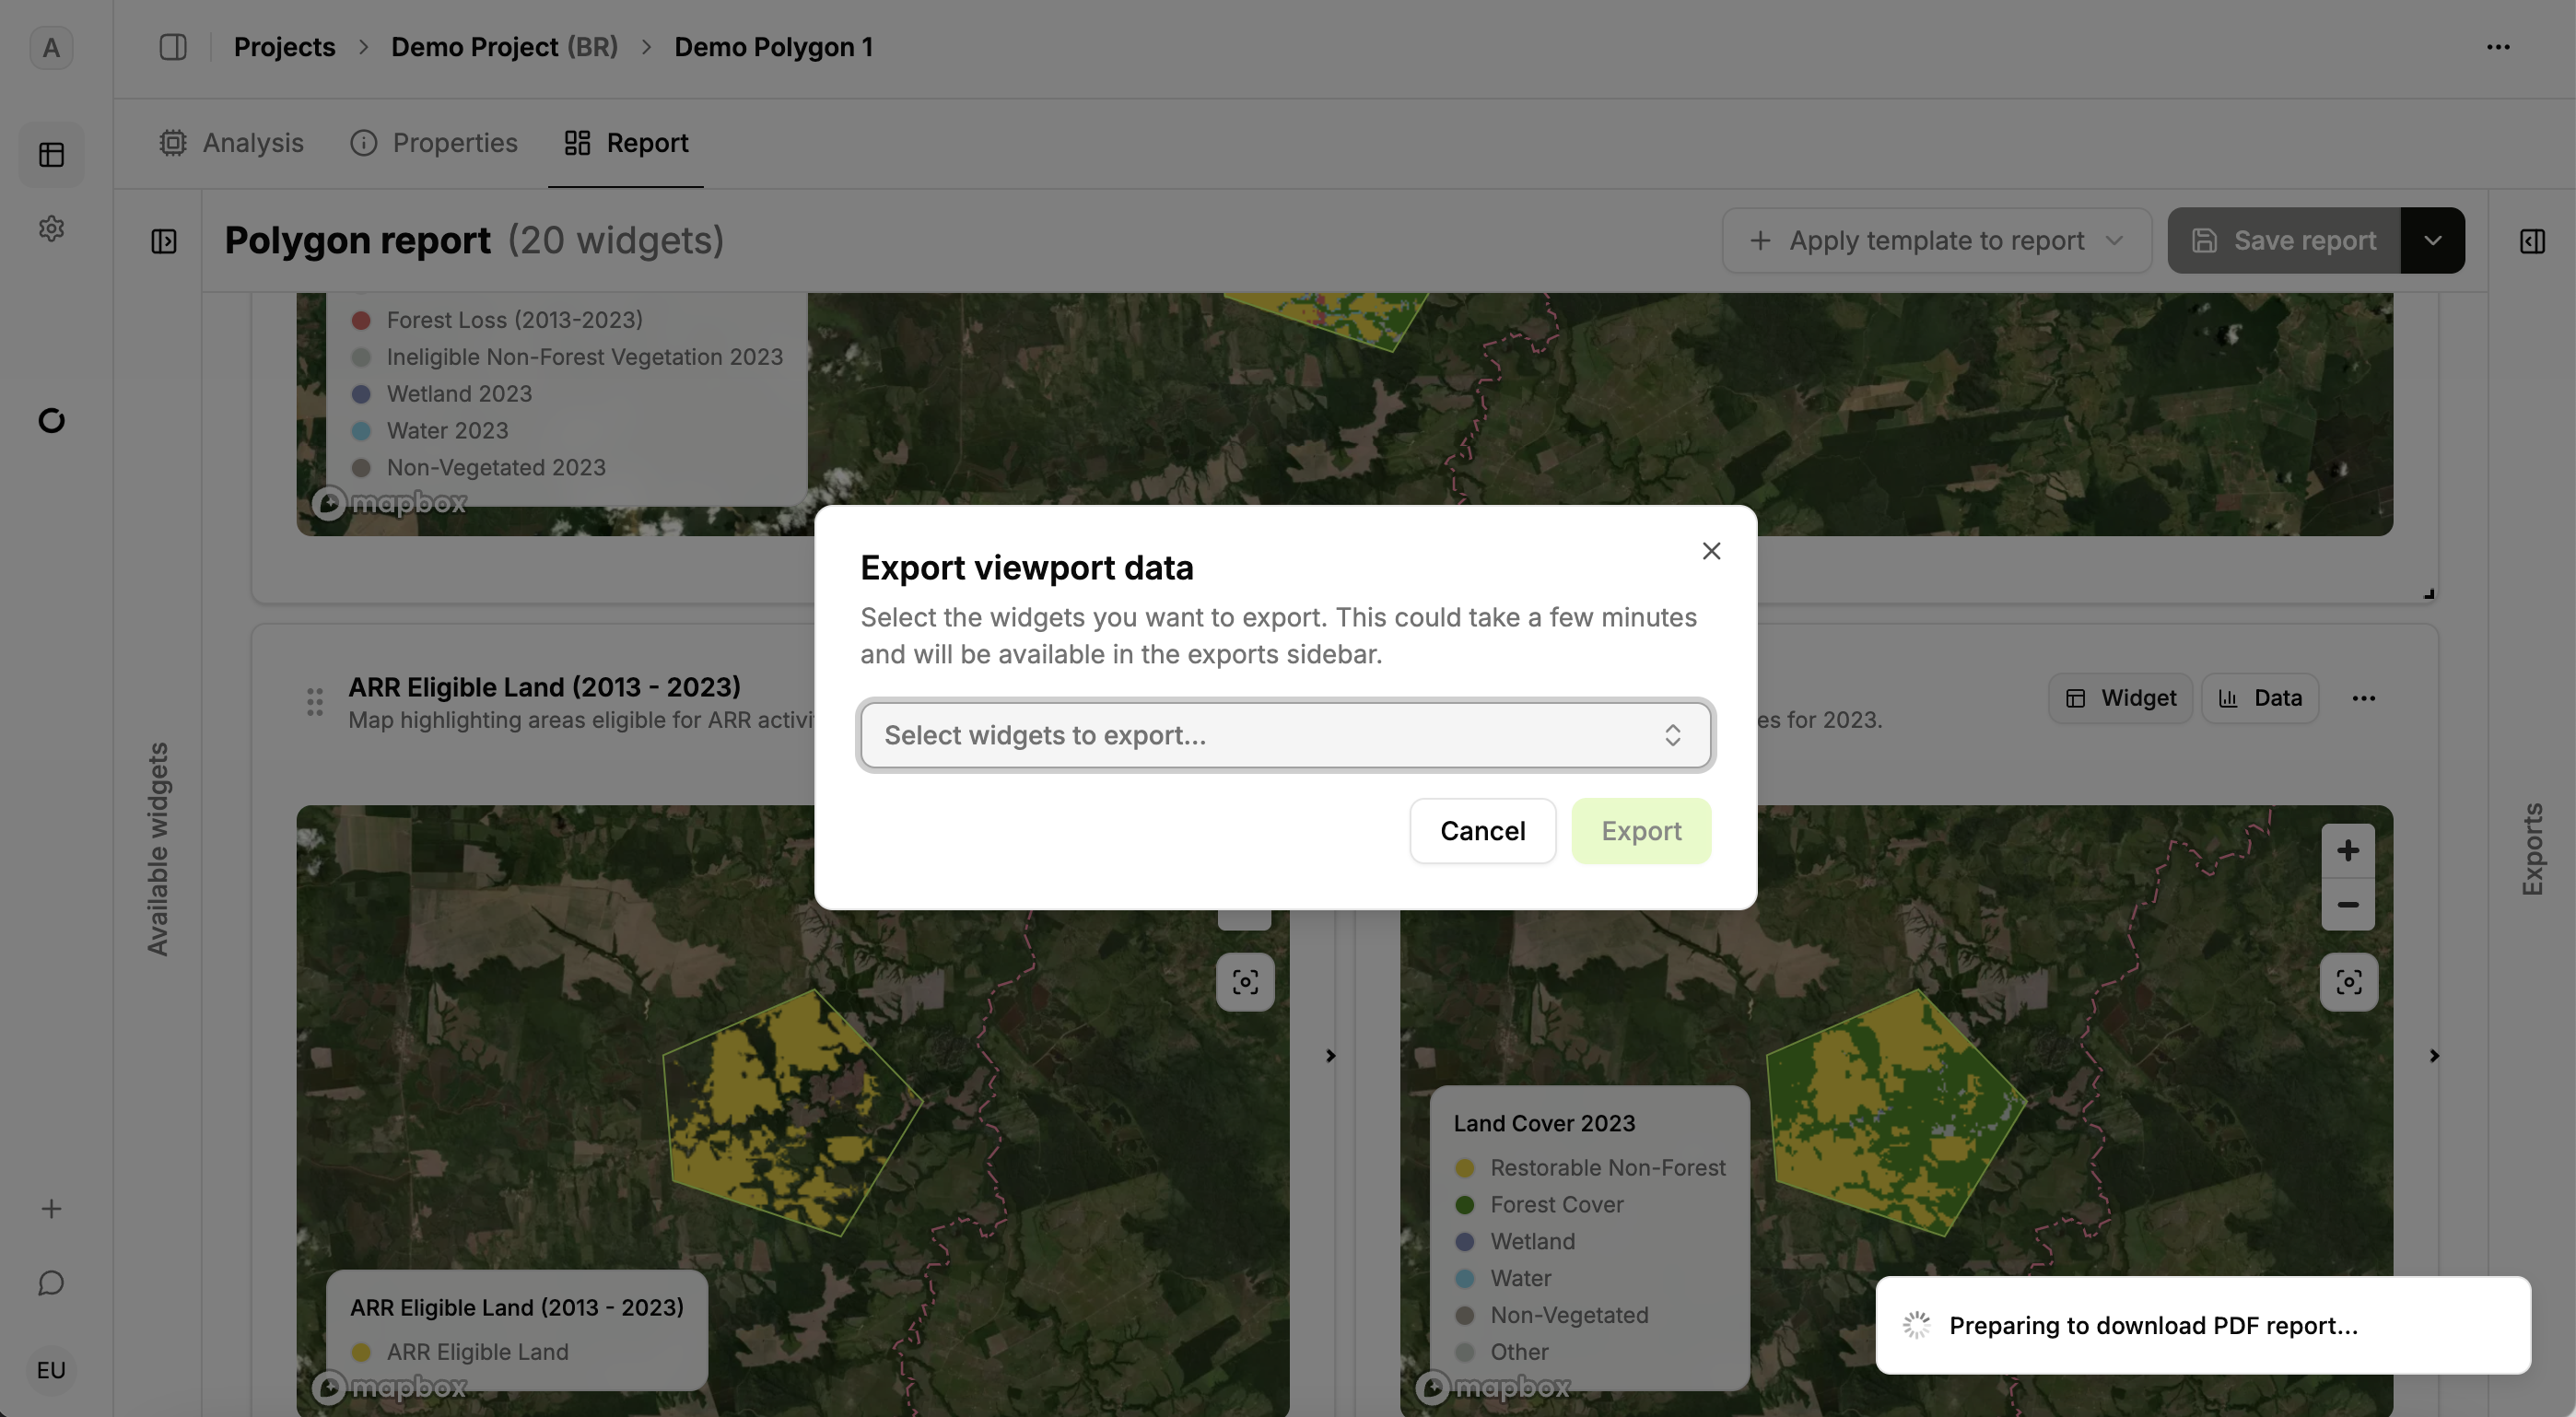
Exports can be accessed in the export drawer on the right side of the screen.
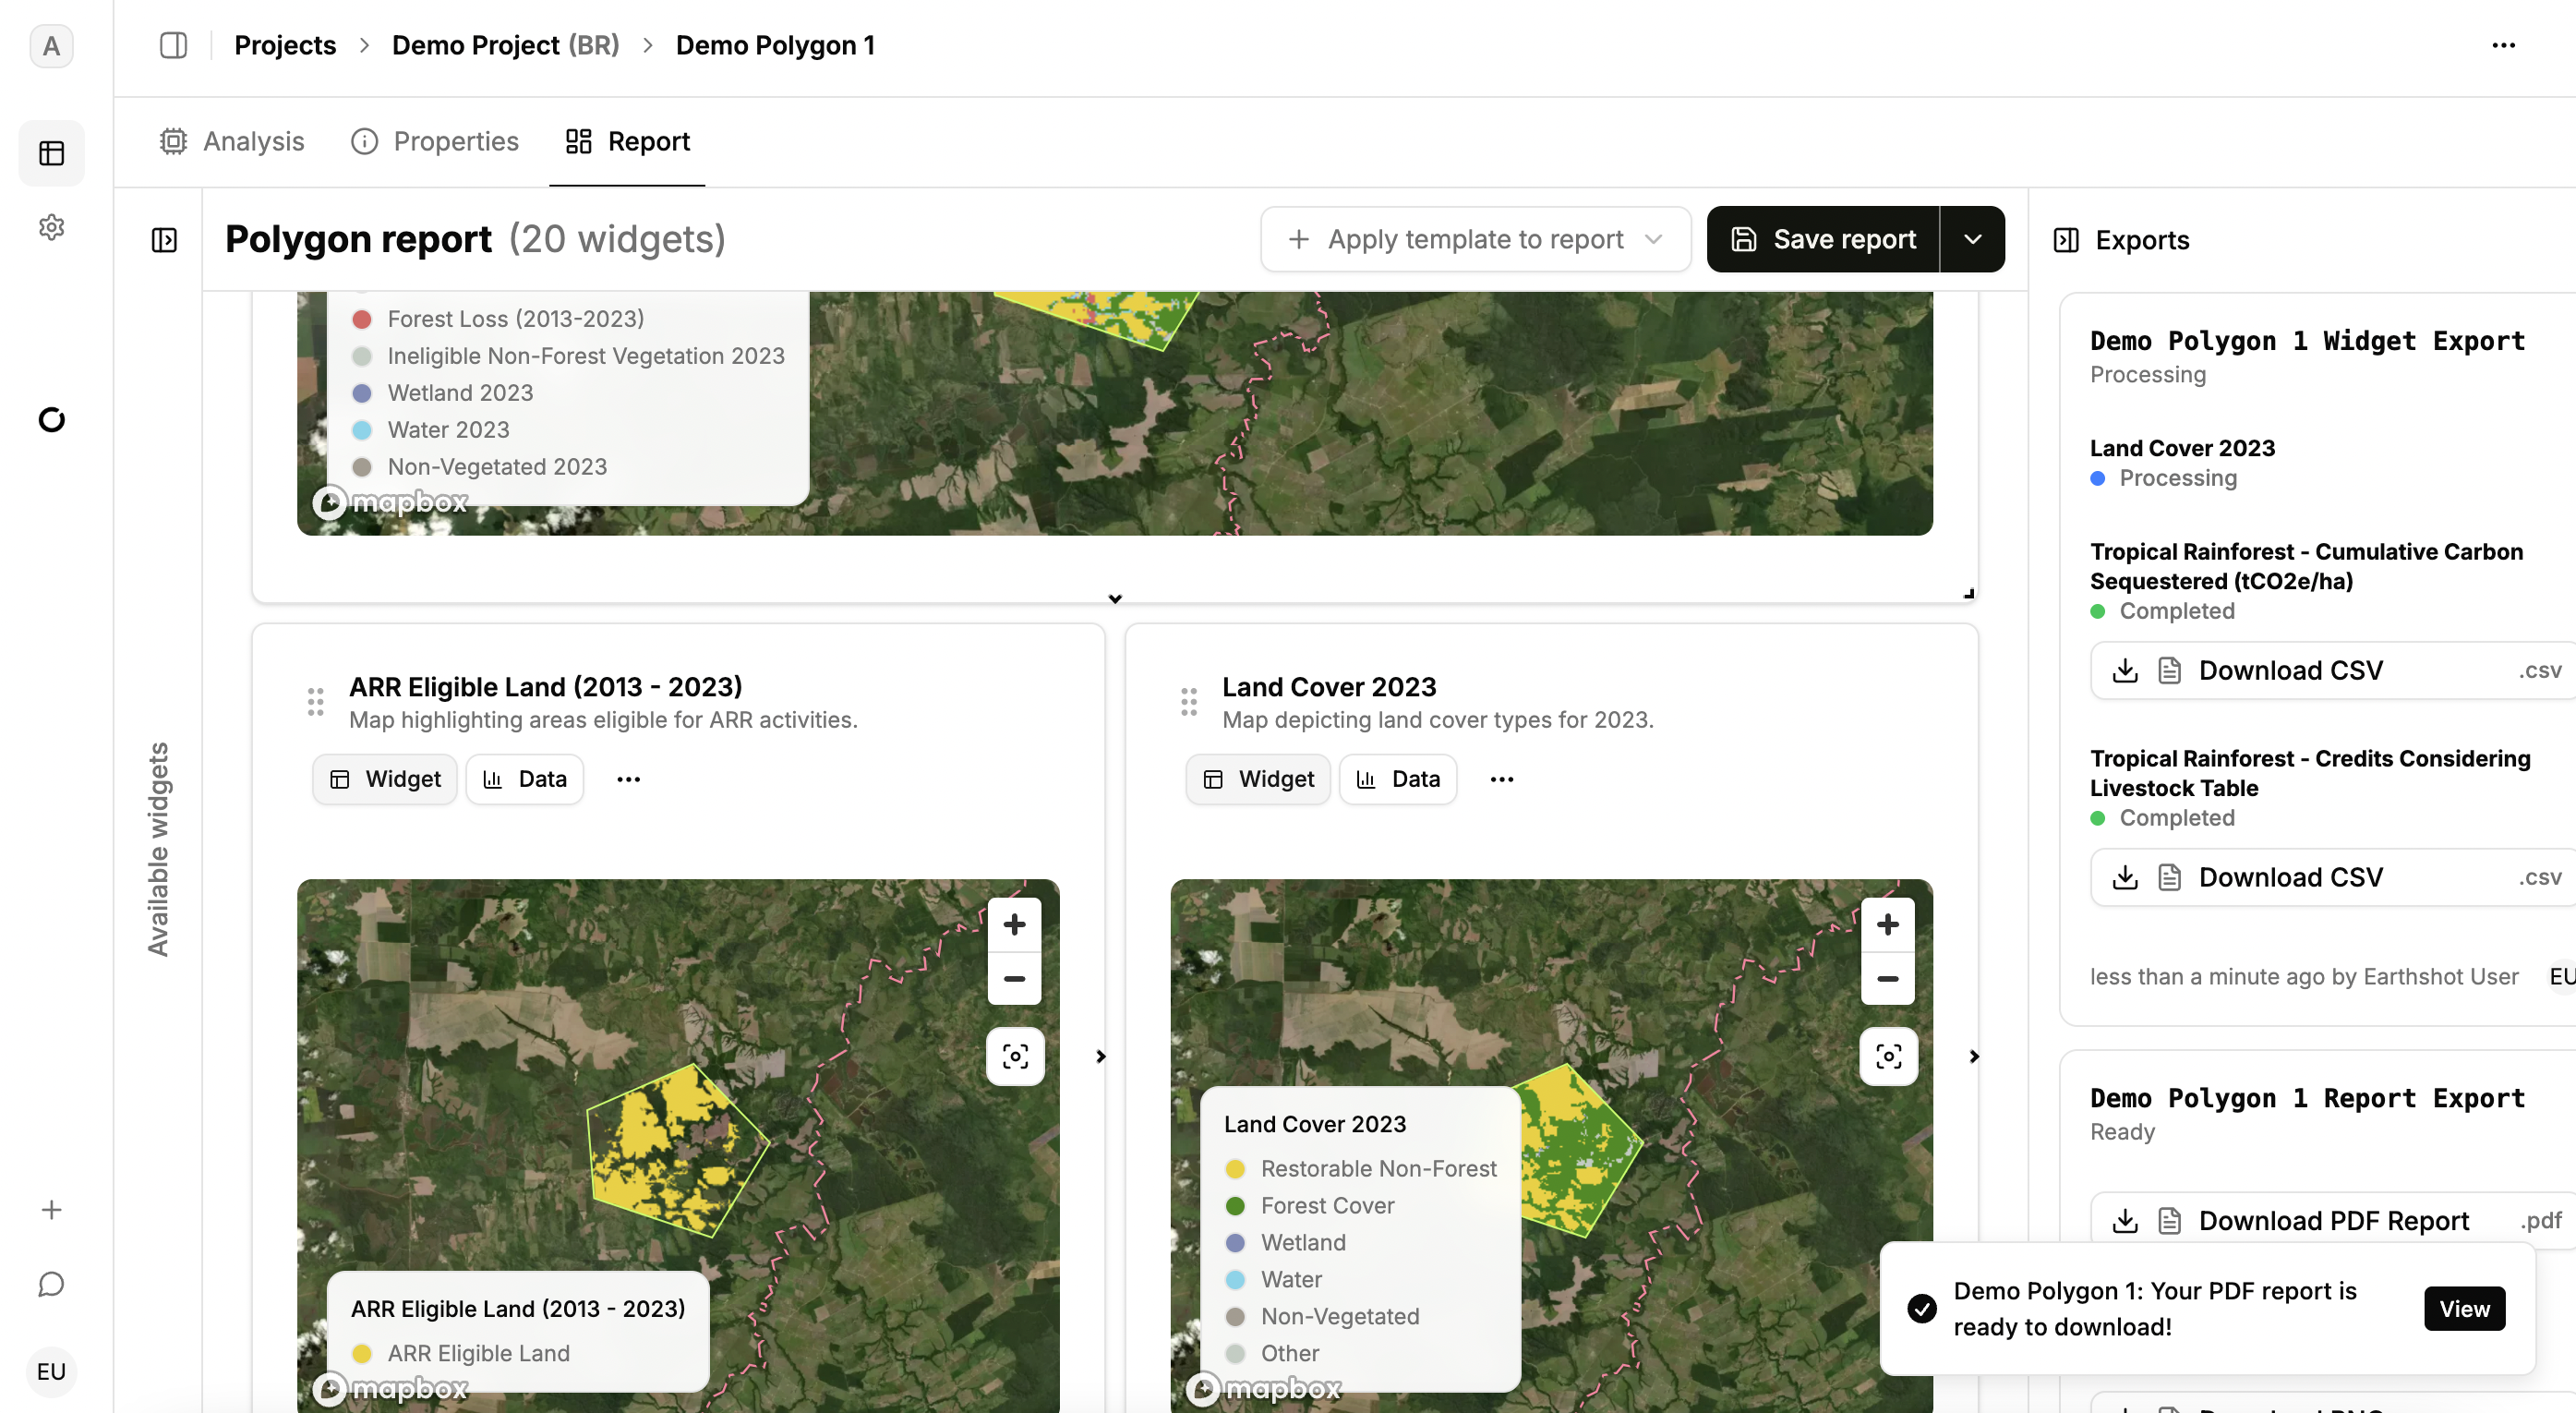
Here you can view which exports are processing and which are complete. When exports are complete a popup will appear at the bottom of the screen and the status in the export drawer will change to complete.
If you downloaded the PDF report, click on “Download PDF Report” in the export drawer to view it.
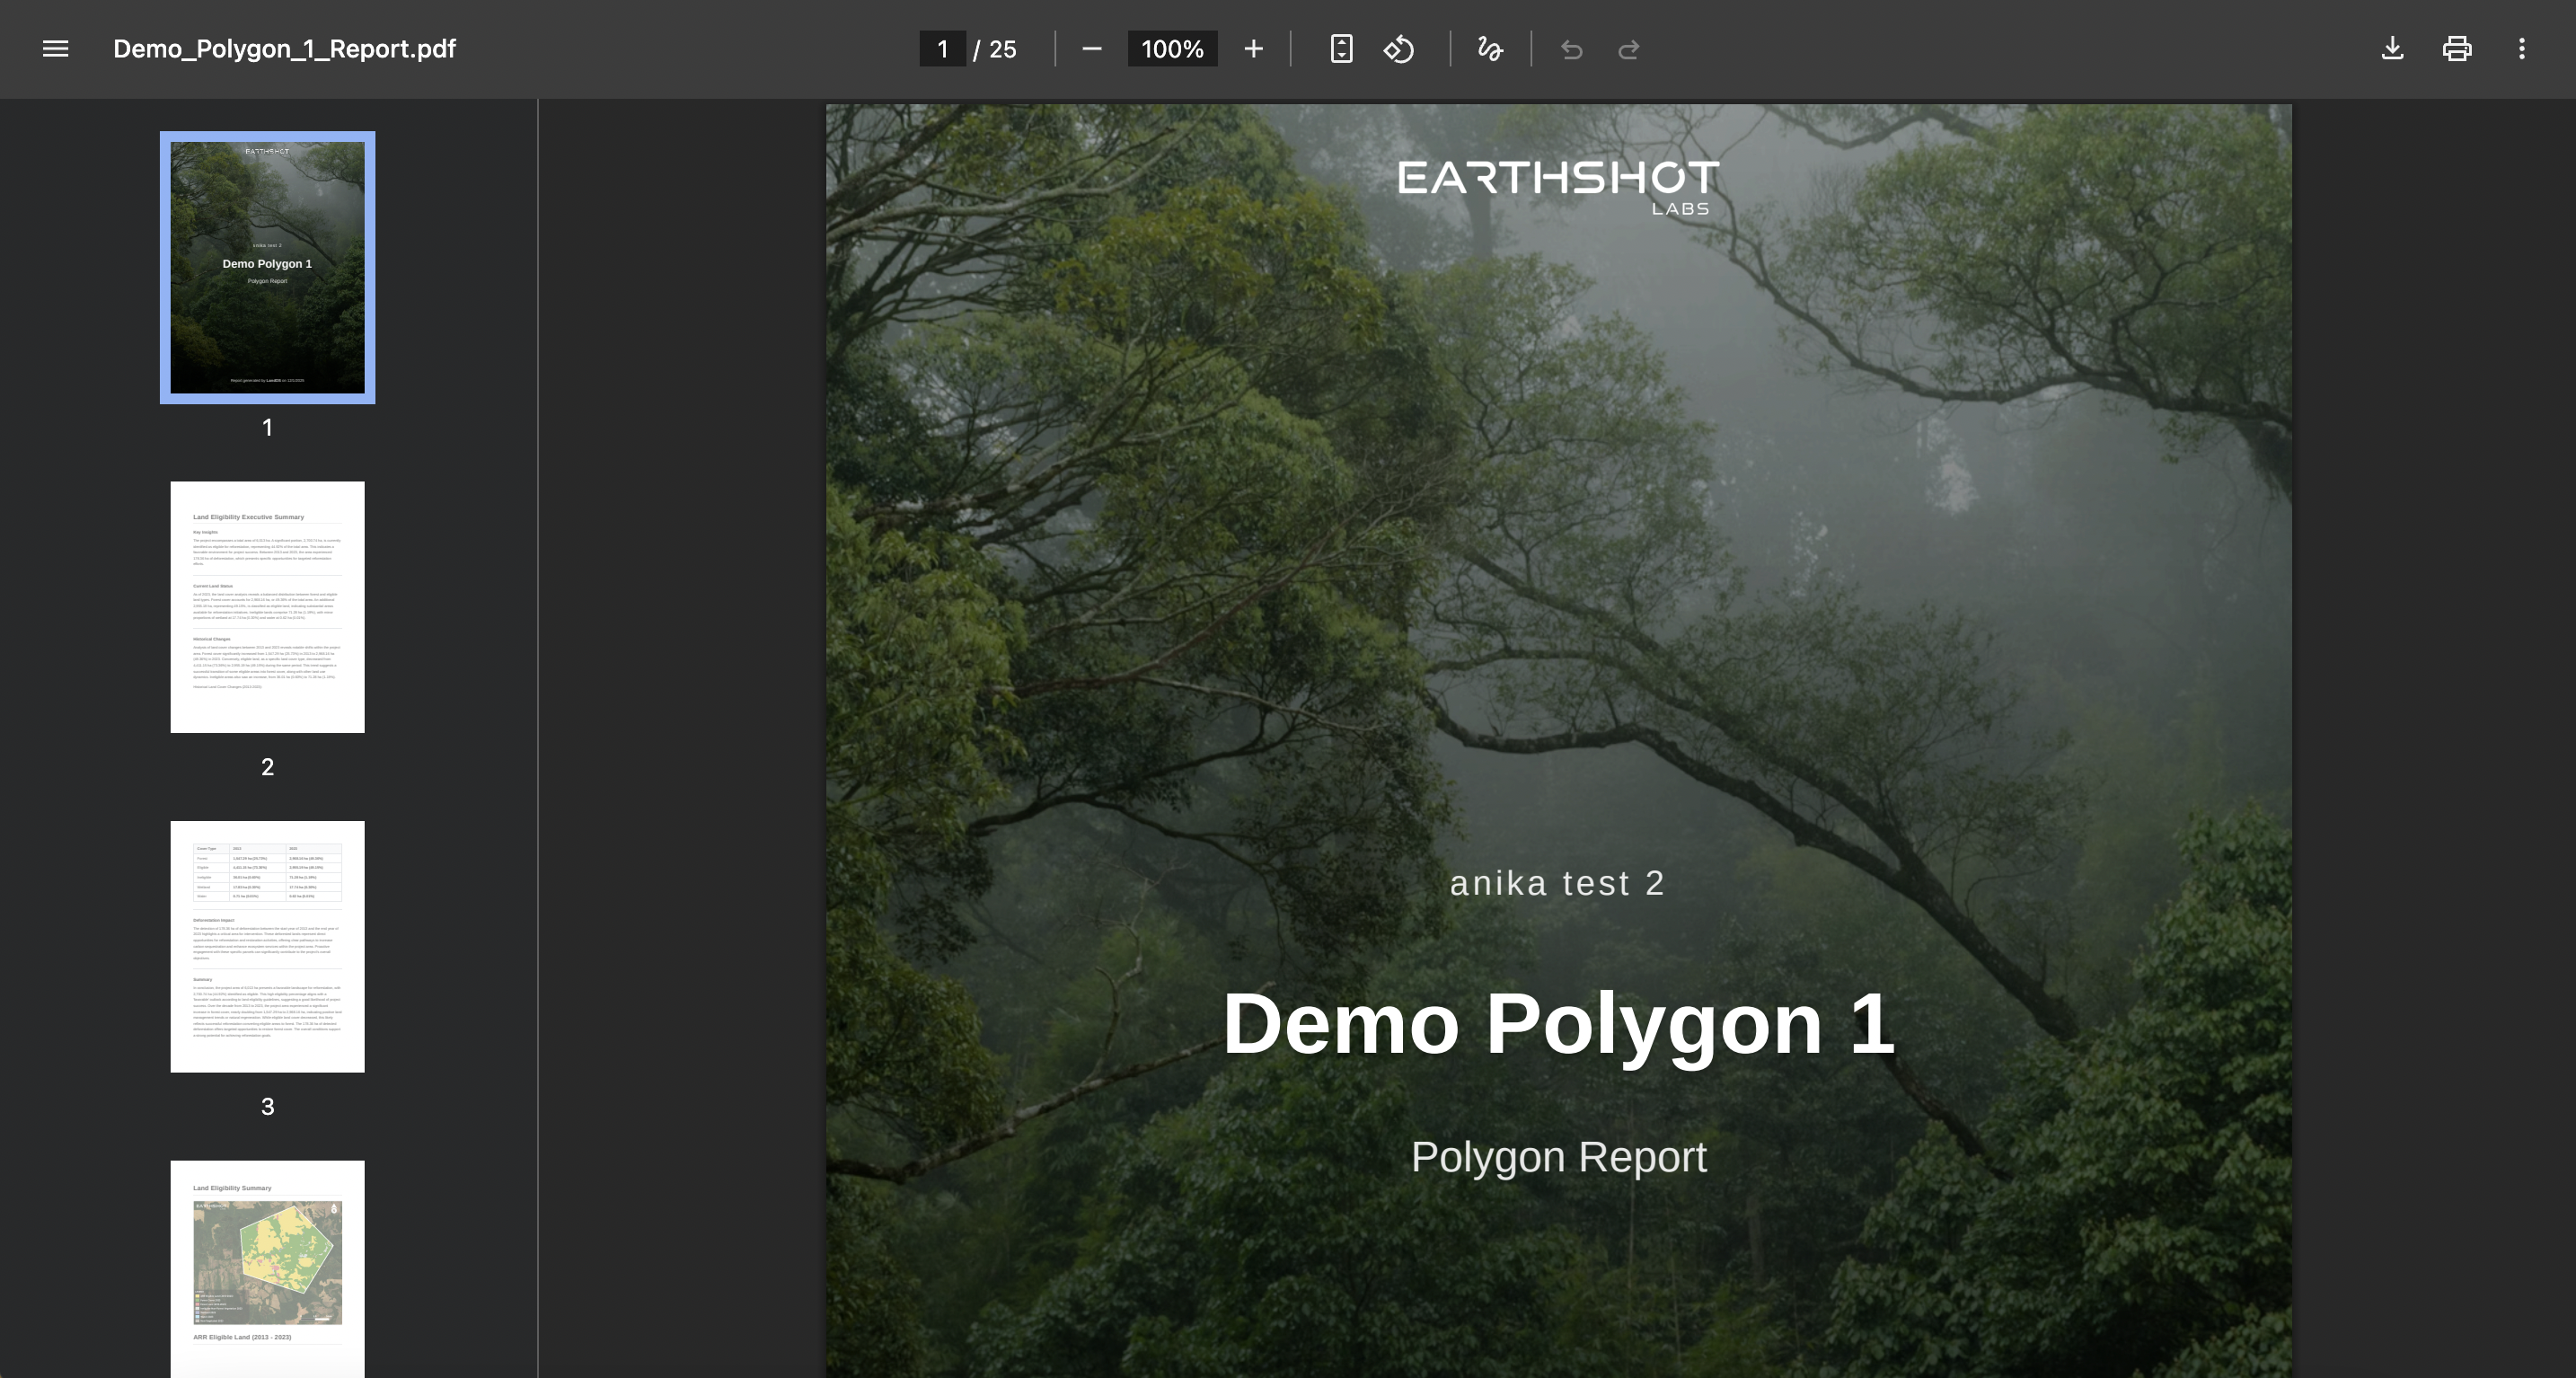
This will open a new tab with the PDF report which can be saved and shared.
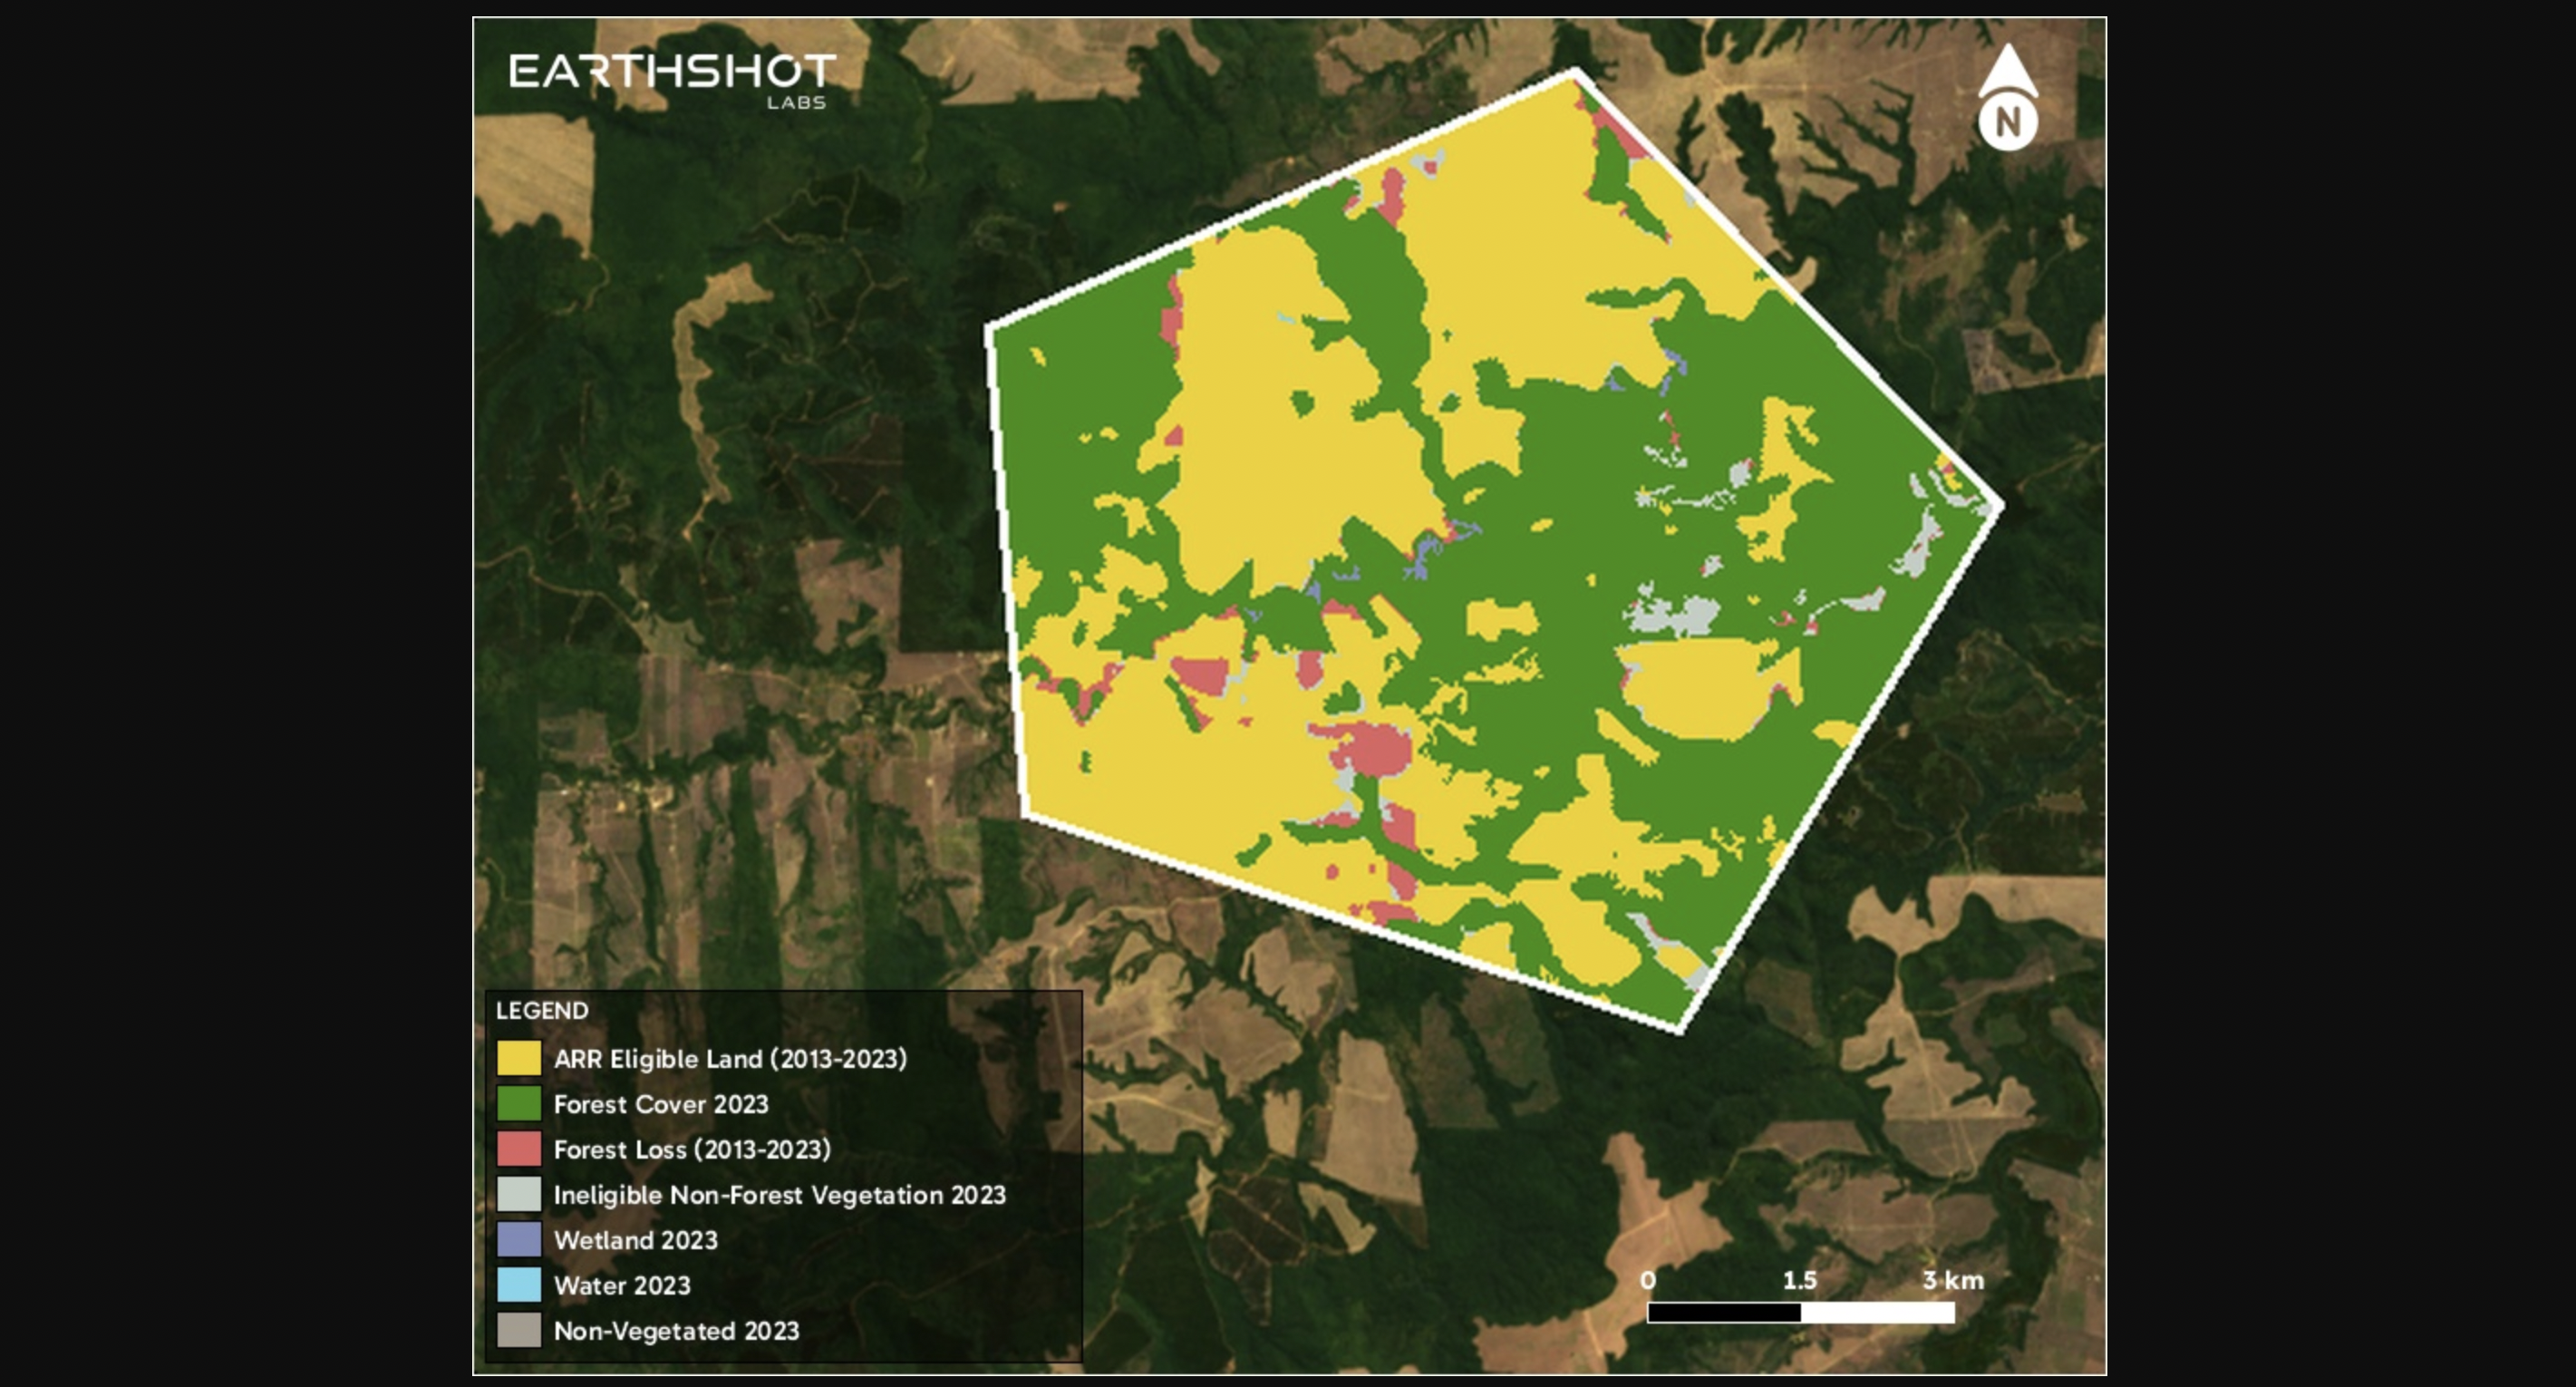
If you access widget data, click on the CSV and PNG files and they will download. The PNG files will open figures in a new tab such as this land cover map.
General Account
Manage your profile, billing, membership, and organization details via User Options from the Projects Table.
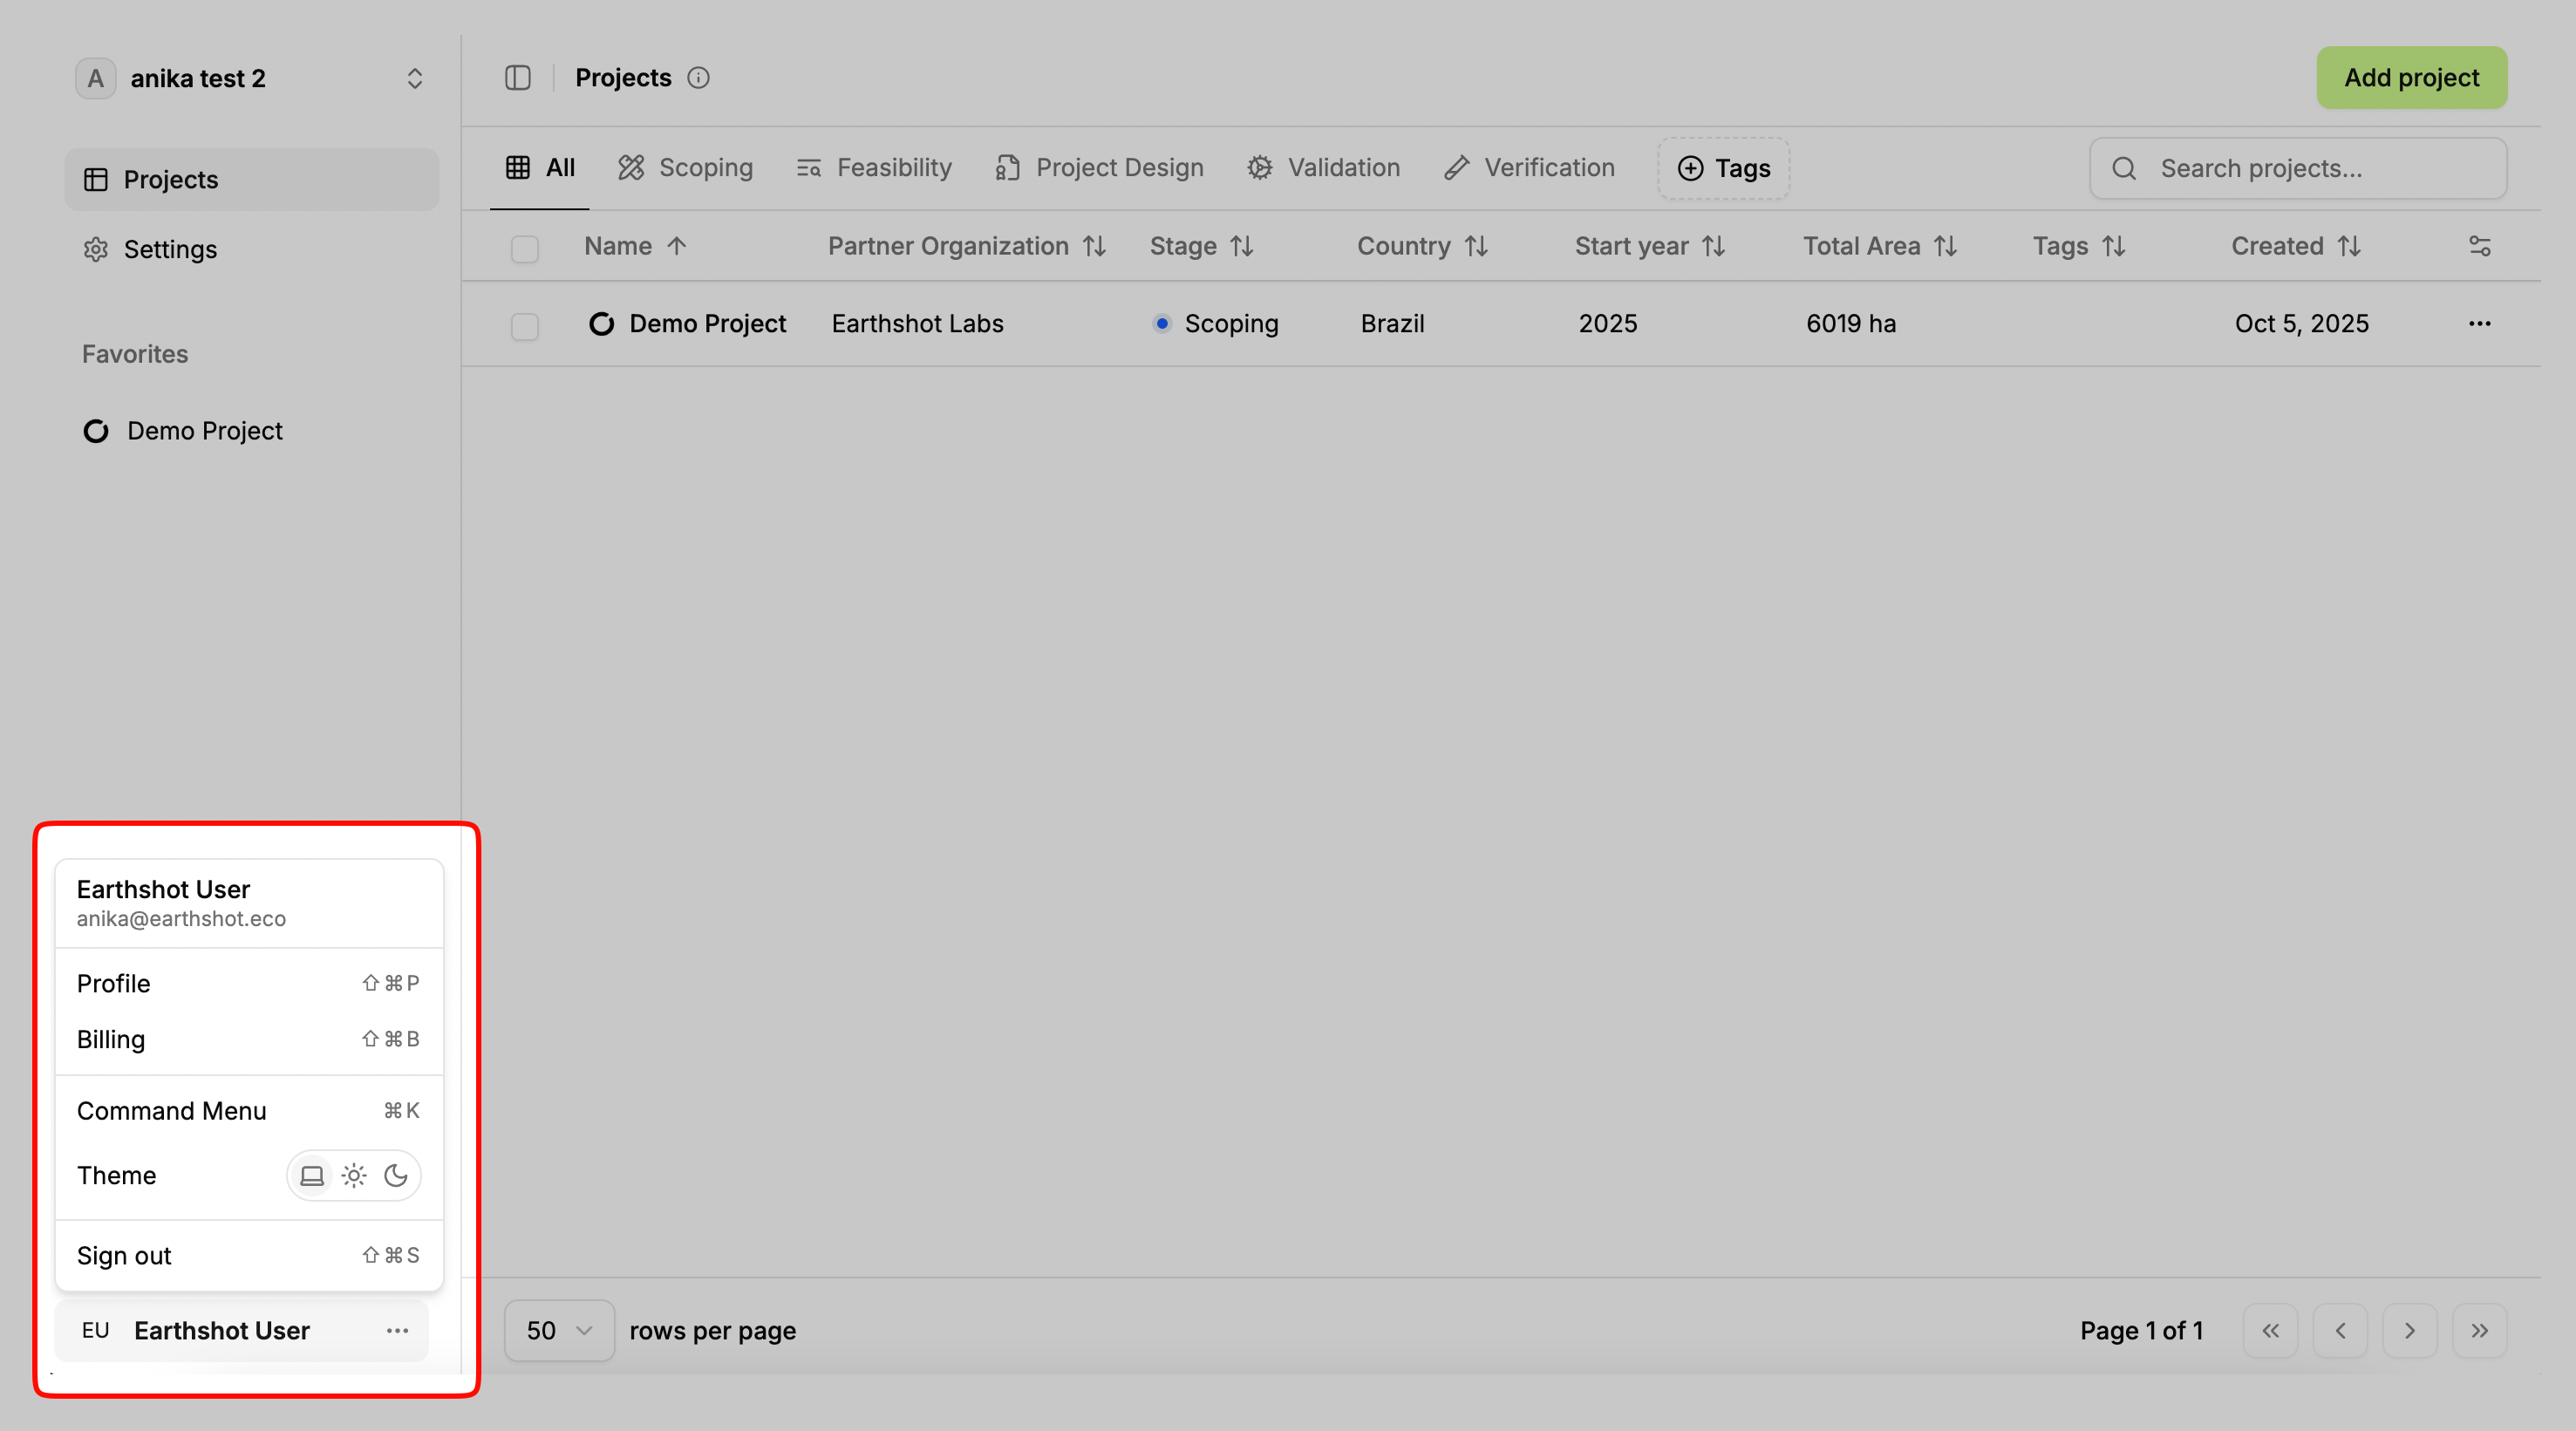
Here you can view your Profile, Billing, Members, change the theme, and sign out.
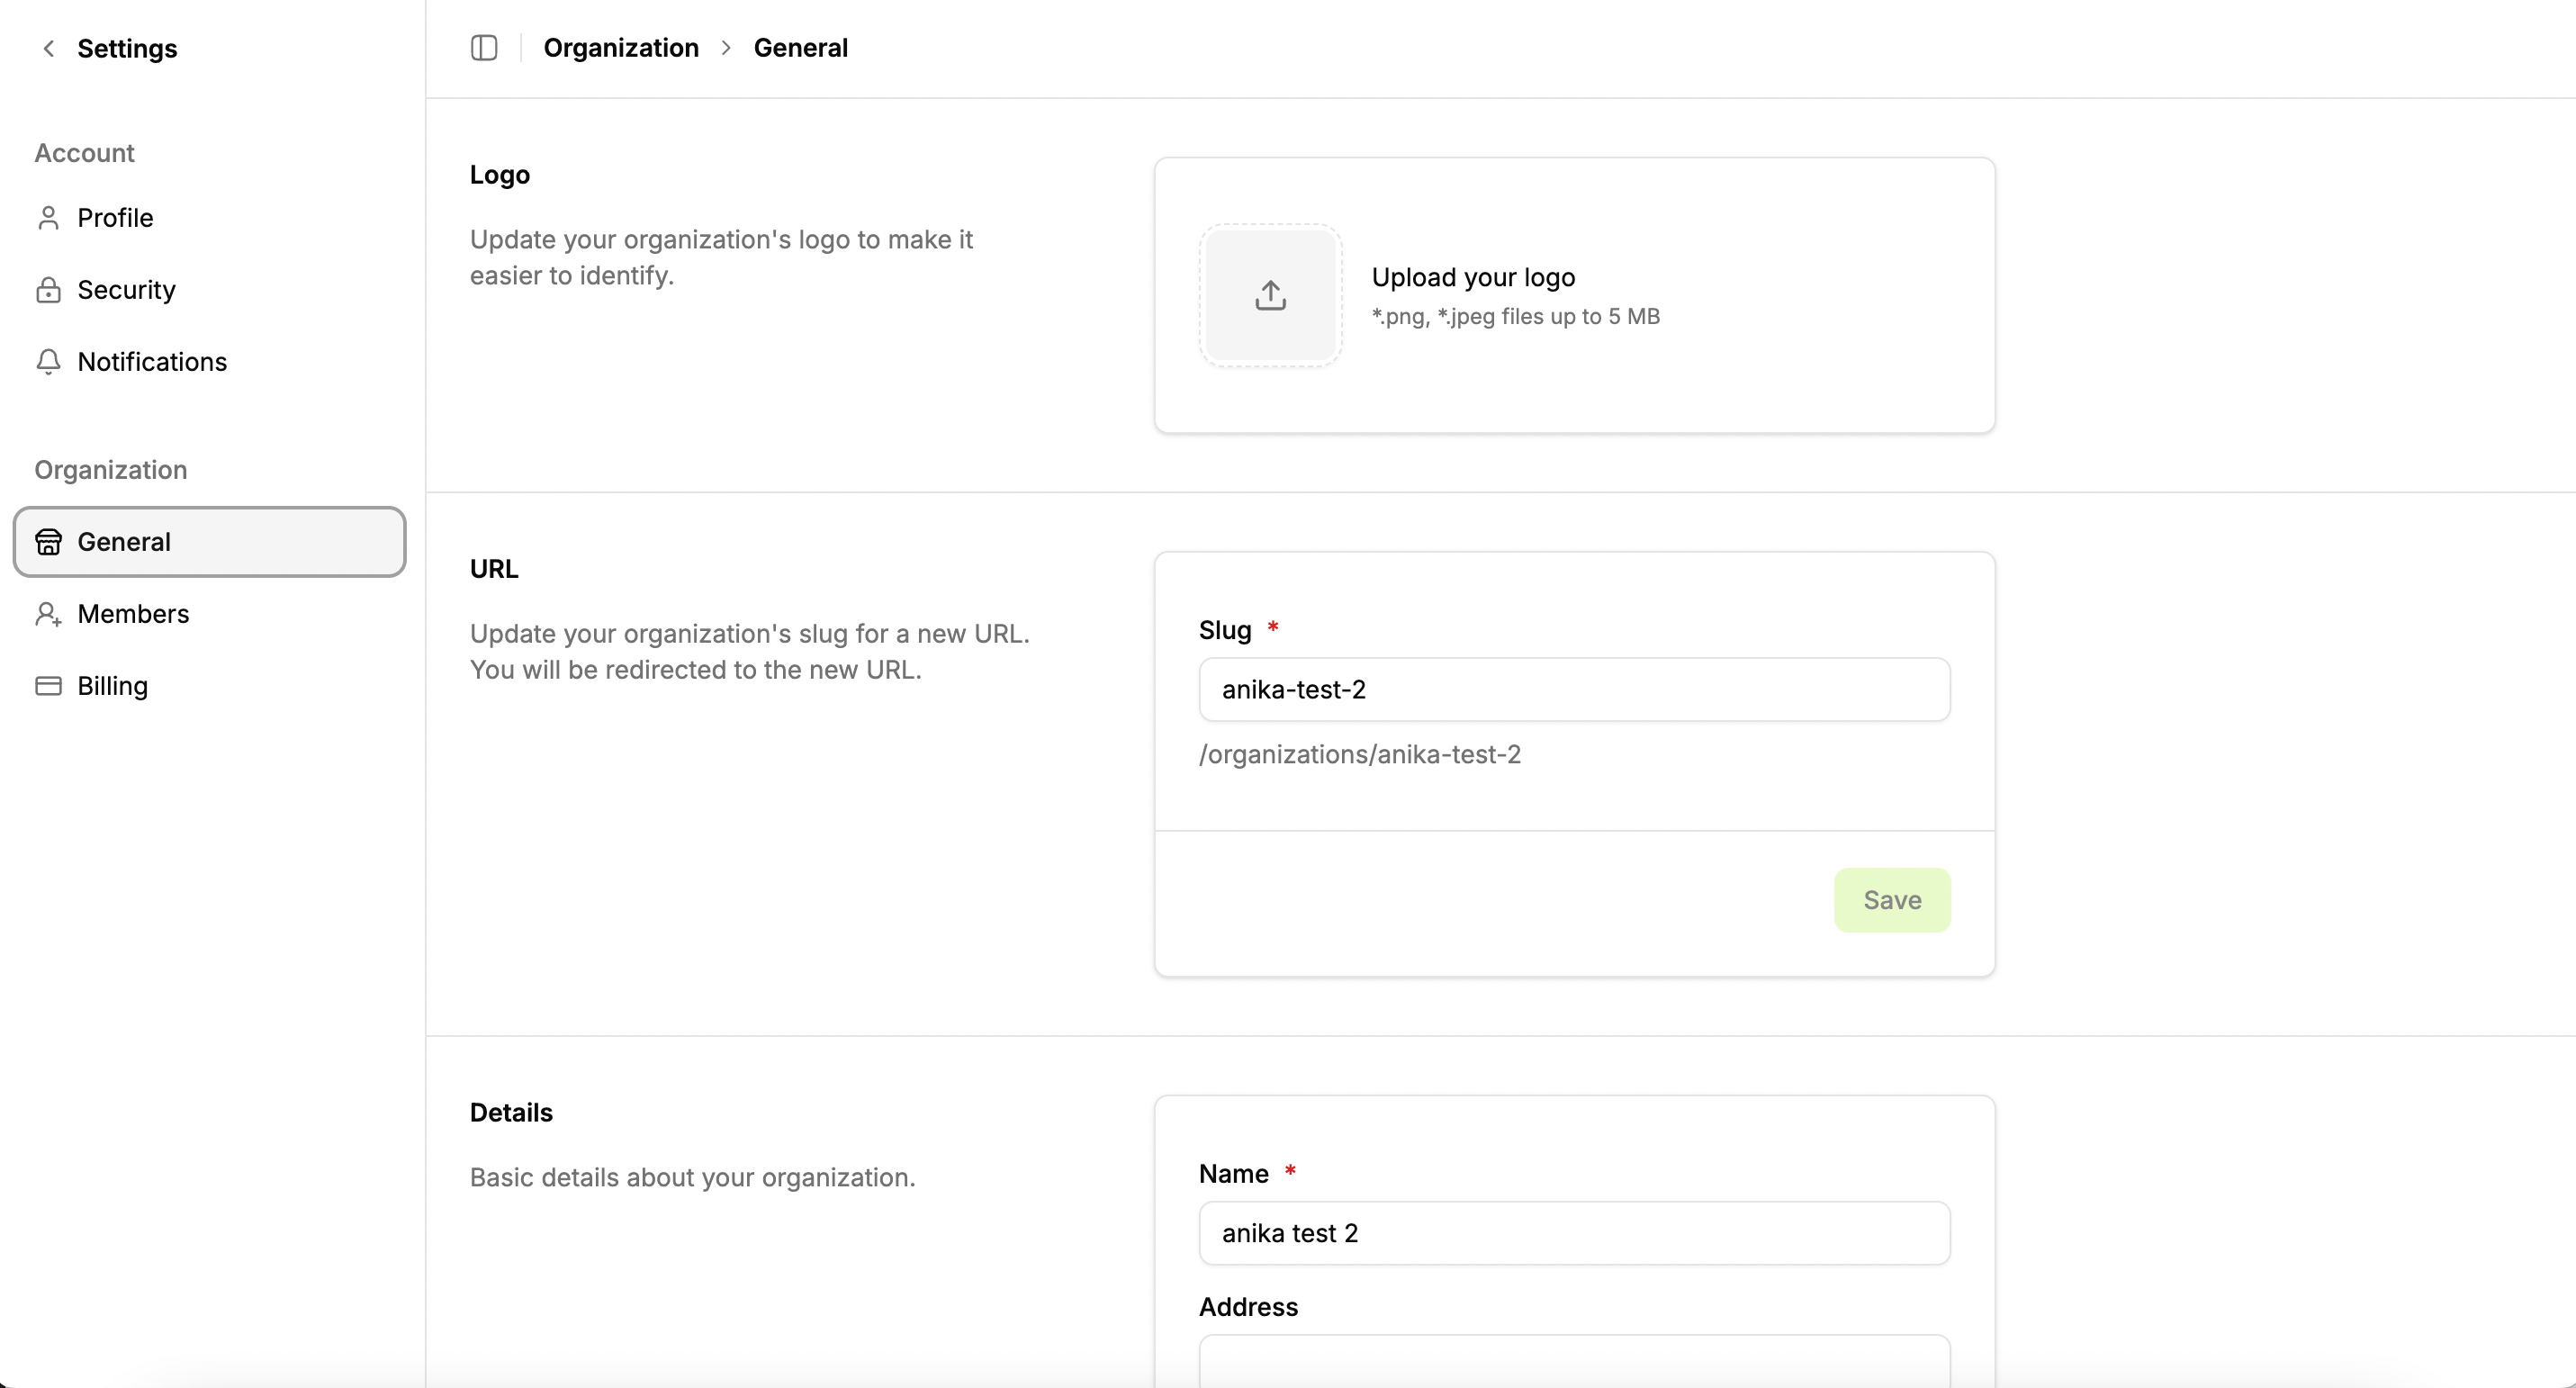
In the general account section, you can change your organization’s Logo, view the url used for your organization, and edit organization details.
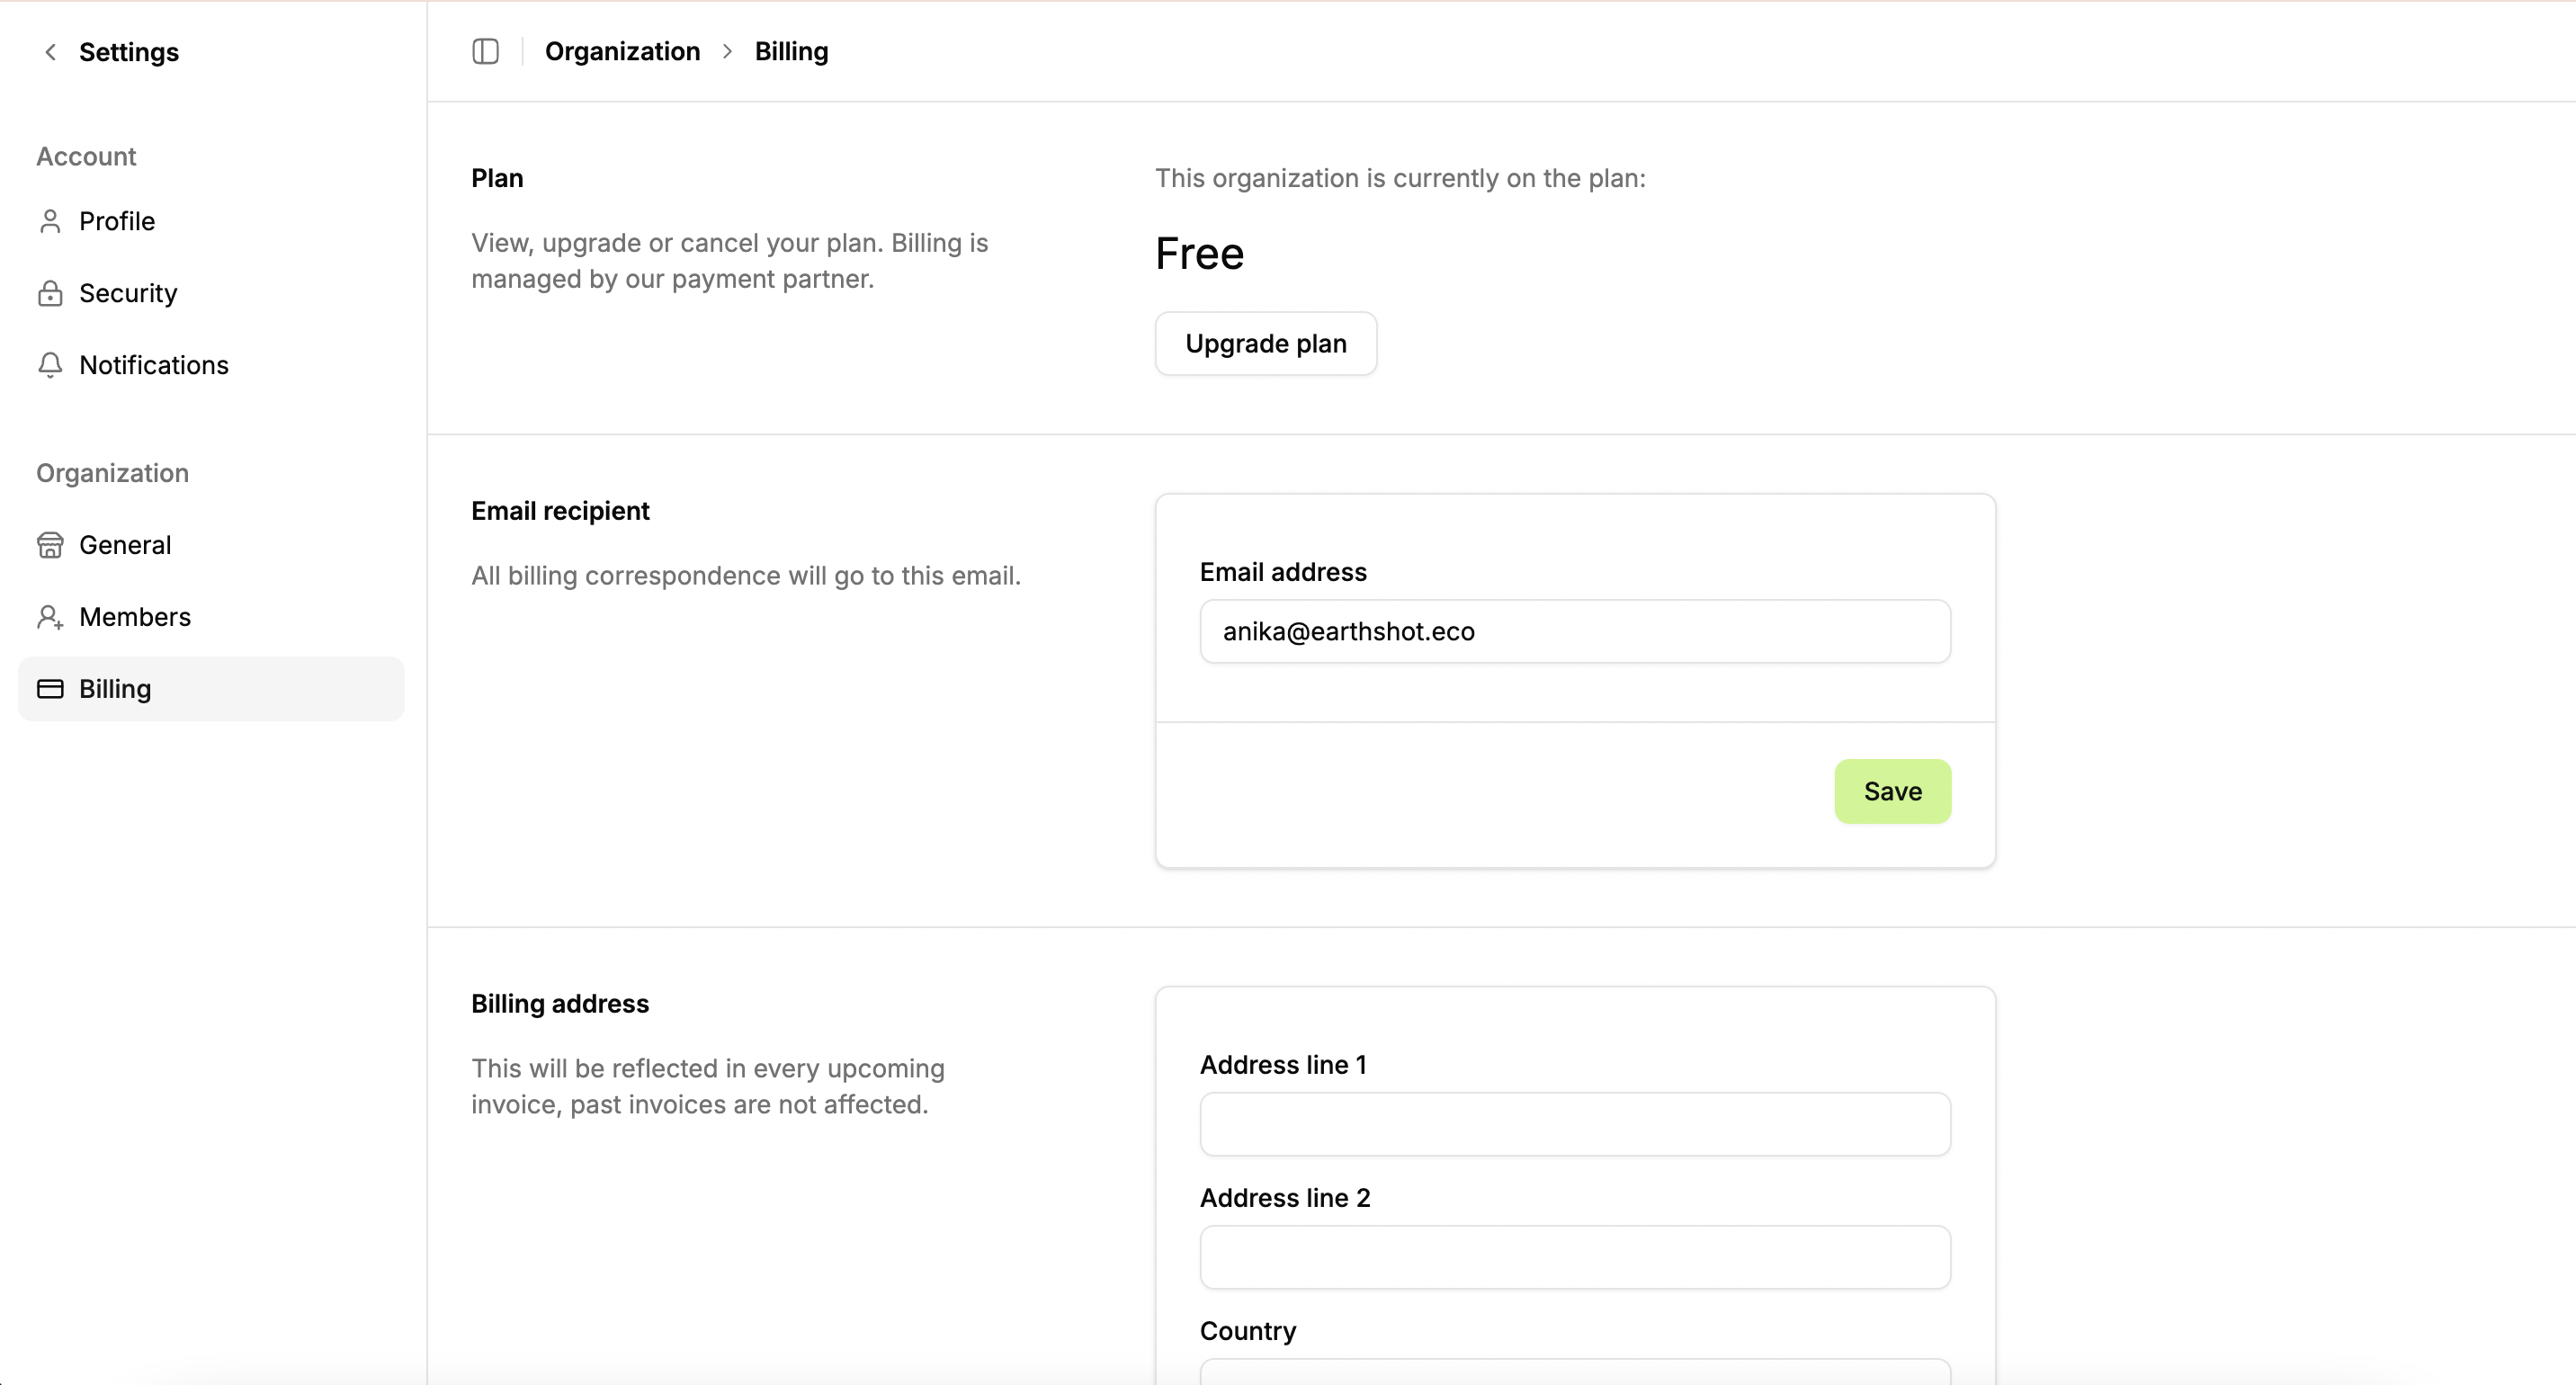
In the billing section you can upgrade your account from the Free to Starter Tier.
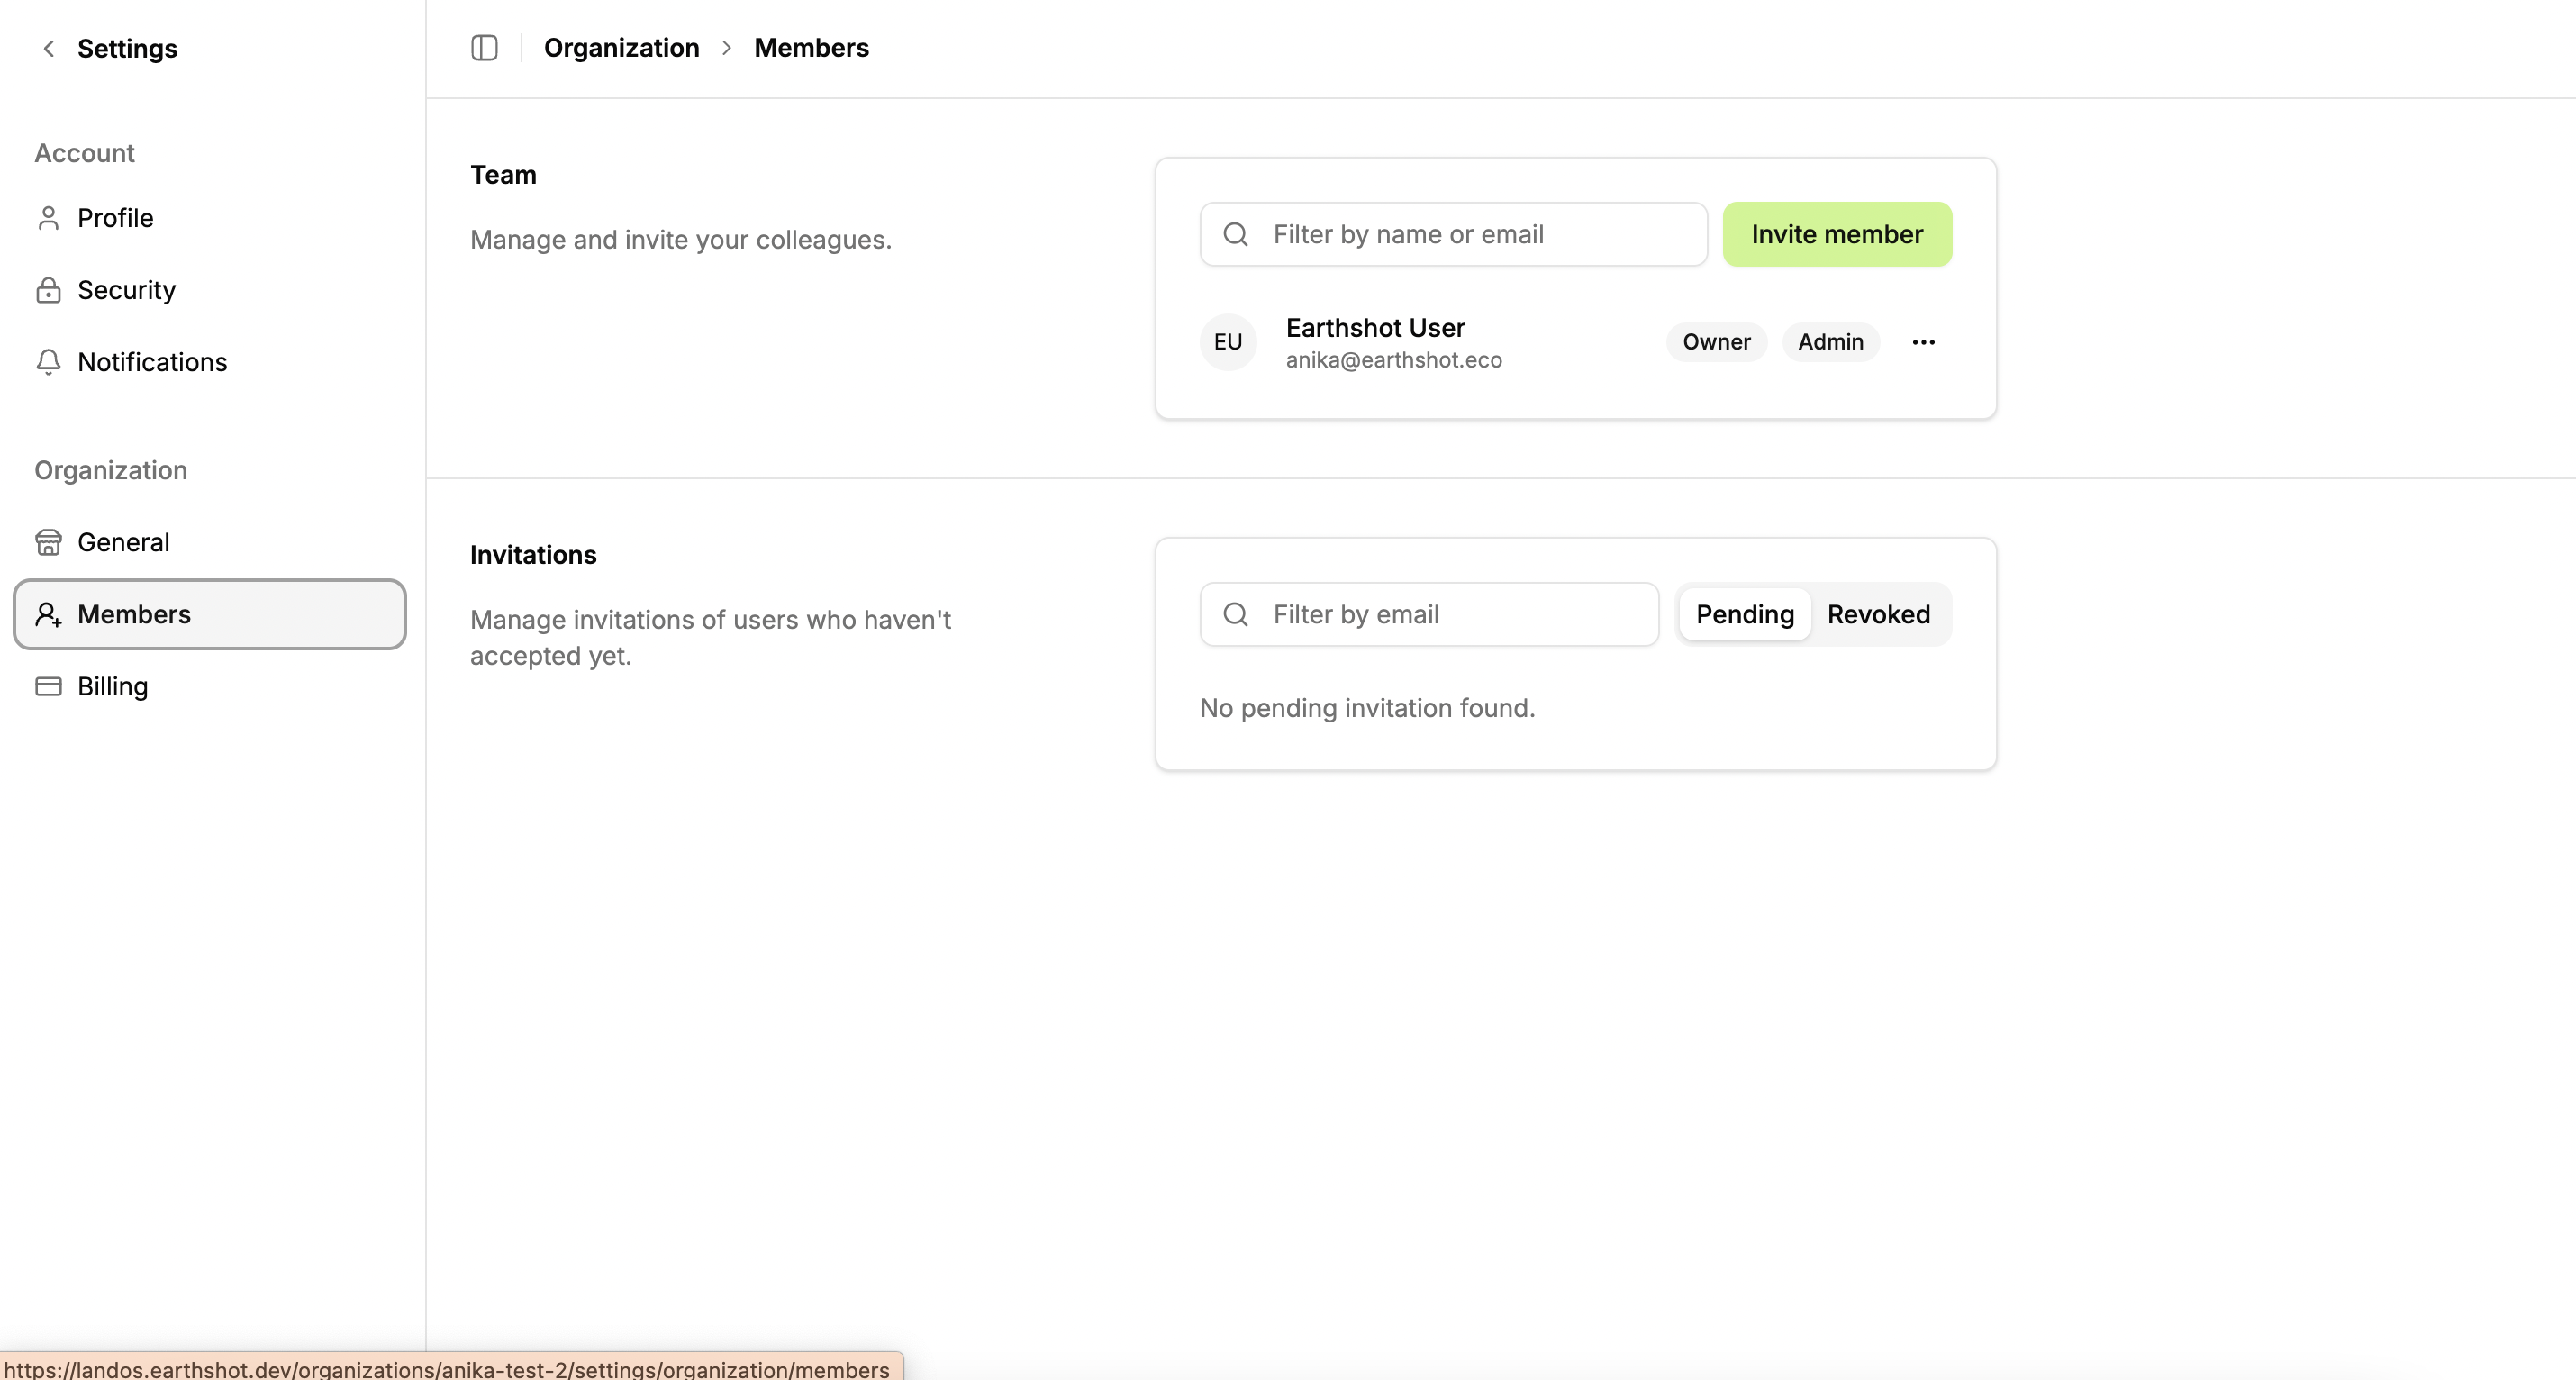
In the members section you can see the members of your organization and send invites to additional team members to join LandOS. Remember that you only need to upgrade to the Starter Tier on one members account and all team members will get access to the upgraded features for seamless collaboration.